Figure 3.

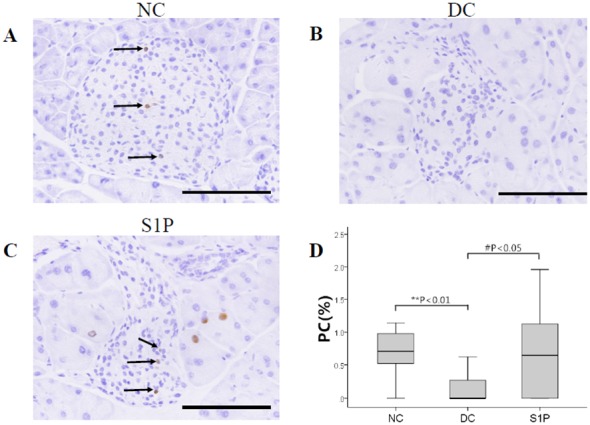
Proliferation rate of islet cells in all groups. Immunohistochemical staining of Ki-67 in mouse islets cells of the (A) NC (n=10), (B) DC (n=8) and (C) S1P (n=9) groups. Arrows indicate the PC. Magnification, ×400; scale bar, 100 µm. (D) Proliferation rate of islet cells in all groups. Values are expressed as the median (interquartile). Statistical analysis was performed using the Kruskal-Wallis H test. **P<0.01; #P<0.05. NC, normal control; DC, diabetic control; S1P, sphingosine-1-phosphate; PC, proliferating cells.
