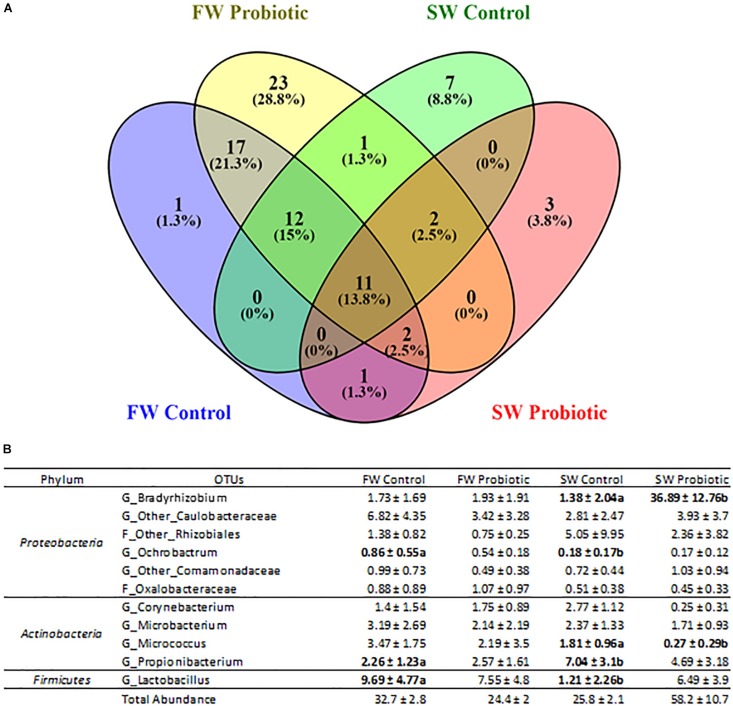
FIGURE 6.
Core microbiota of distal intestinal mucosa. (A) Venn diagram showing the shared OTUs across 100% of the samples in all the experimental groups. (B) Relative abundance contribution for each of the OTUs belonging to the core microbiota of each experimental group. FW, SW stages. Values are means ± SD (n = 6), letters are present when a significant difference was identified by LEfSe.

