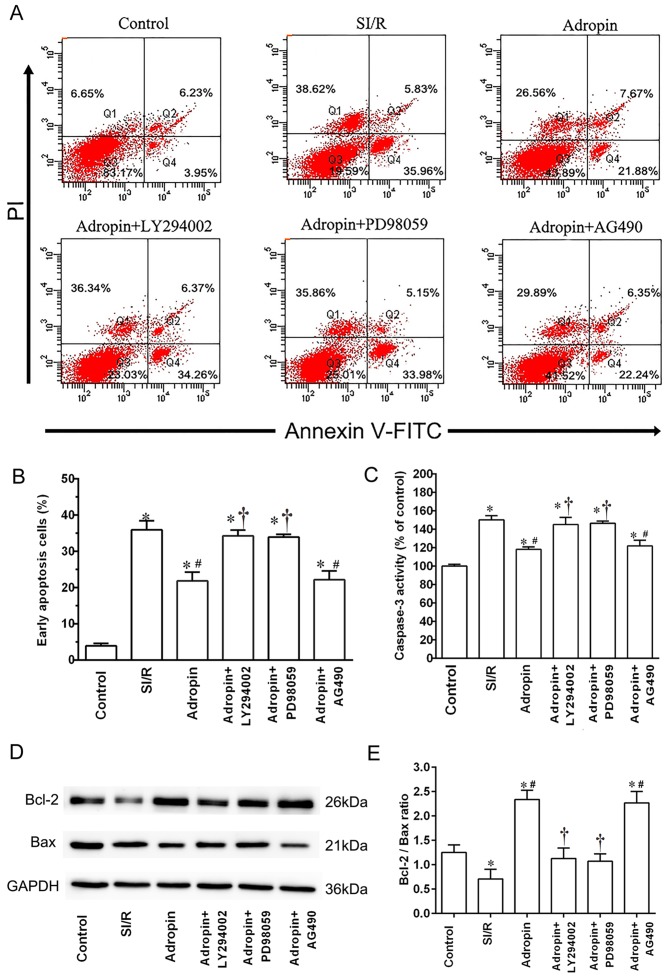
Figure 2.
Effect of adropin on cell apoptosis and caspase-3 activity. (A and B) Apoptotic rates were quantified by annexin V-FITC/PI double staining cytometry. Viable cells are annexin V-FITC−/PI− (Q3); annexin V-FITC+/PI− cells (Q4) are early in the apoptotic process; annexin V-FITC+/PI+ cells (Q2) are late in the apoptotic process; and necrotic cells are Annexin V-FITC−/PI+ (Q1). (C) Caspase-3 activity analysis. *P<0.001 vs. control; #P<0.001 vs. SI/R; †P<0.001 vs. adropin. Results are representative of three independent experiments. (D) Western blot analysis and (E) subsequent quantification of Bcl-2 and Bax expression. Mean ± standard deviation of relative Bcl-2/Bax ratios are presented. Data were normalized to loading control GAPDH. *P<0.05 vs. control; #P<0.05 vs. SI/R; †P<0.05 vs. adropin. PI, propidium iodide; SI/R, simulated ischemia/reperfusion.

