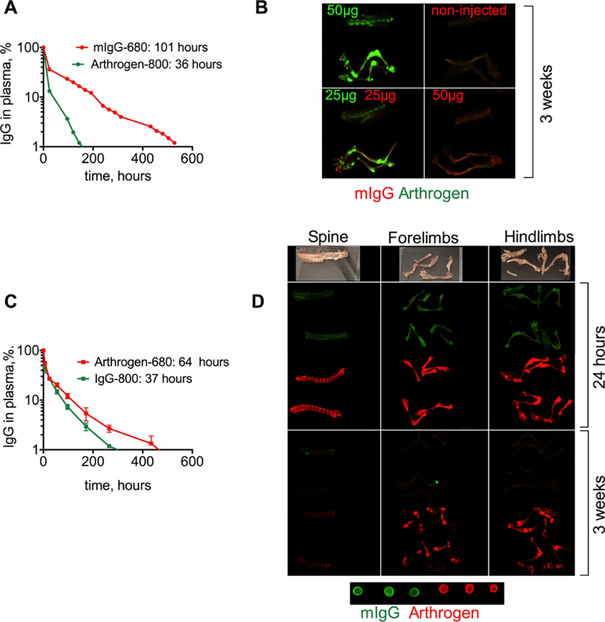
Figure 2.
Accumulation of Arthrogen in joints of healthy BALB/c mice after iv injection: (A) circulation profile and pharmacokinetic data (slow phase) of Arthrogen-800 and control mouse IgG-680. The experiment was repeated twice; (B) images of dissected bones of Arthrogen-injected (green) and mIgG-injected (red) mice. Arthrogen clearly localized in the joints. In each panel, from top to bottom: spine, hind limb, and forelimb. Contrast in 700 and 800 nm channels was adjusted to the same extent for all mice; (C) circulation profile and pharmacokinetic data (slow phase) of Arthrogen-680 and control mouse IgG-800; (D) images at 24 h (perfused mouse) and 3 weeks post-injection show fast and specific accumulation of Arthrogen in the joints and the spine. In this experiment, the labeling dyes were swapped, mIgG (green) and Arthrogen (red). Dots show 100× dilution of each antibody applied on nitrocellulose membrane and scanned together with the organs. The photographs and scans of all bones and major organs are in Figure S2.

