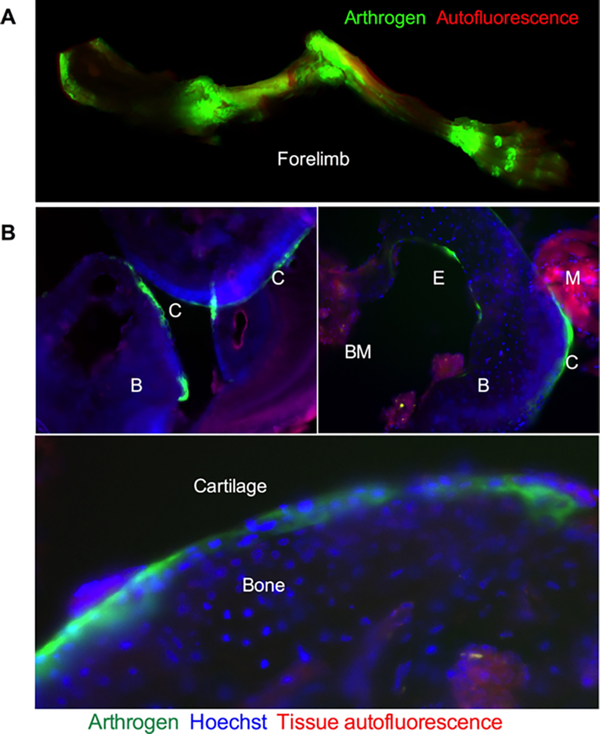
Figure 5.
High-resolution NIR imaging of the bones after Arthrogen injection: (A) forelimb from Arthrogen-injected mouse (Figure 3) scanned at 24 μm resolution with Li-COR. The high-resolution image shows accumulation in the joints, tendons, and to some extent in the diaphysis of the bone; (B) histological sections of knee and elbow joints of Arthrogen-injected mouse imaged with a NIR microscope. The antibody not only accumulated in the cartilage (C) but also was observed on the endosteal surface (E). B = bone, BM = bone marrow, and M = for muscle. High magnification (bottom) shows accumulation in chondrocytes in the cartilage. Red autofluorescence (rhodamine filter) highlights muscle and bone marrow.

