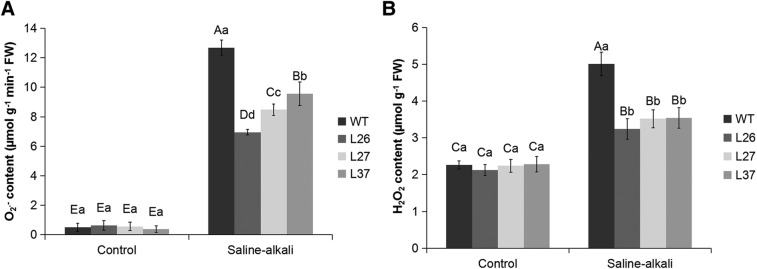
Fig. 6.
ROS accumulation in WT and transgenic tobaccos under saline-alkali stress. From left to right, the four-color histogram shows WT, L26, L27 and L37. Effects of normal condition and saline-alkali stress on O2.− productivity rate (A) and H2O2 concentrations (B) in the leaves of WT and transgenic tobacco lines. Each data column represents the mean (with s.d. bar) of three replicates. One-way ANOVA post hoc multiple comparisons, LSD and Duncan's multiple range tests were selected simultaneously in equal variances assumed. The different uppercase letters and lowercase letters represent significant differences (P<0.05) according to LSD and Duncan's multiple range tests. The different uppercase letters represent significant differences in sample data of both control and treatment group (P<0.05). Different lowercase letters represent significant differences of the sample data of control or treatment group (P<0.05).

