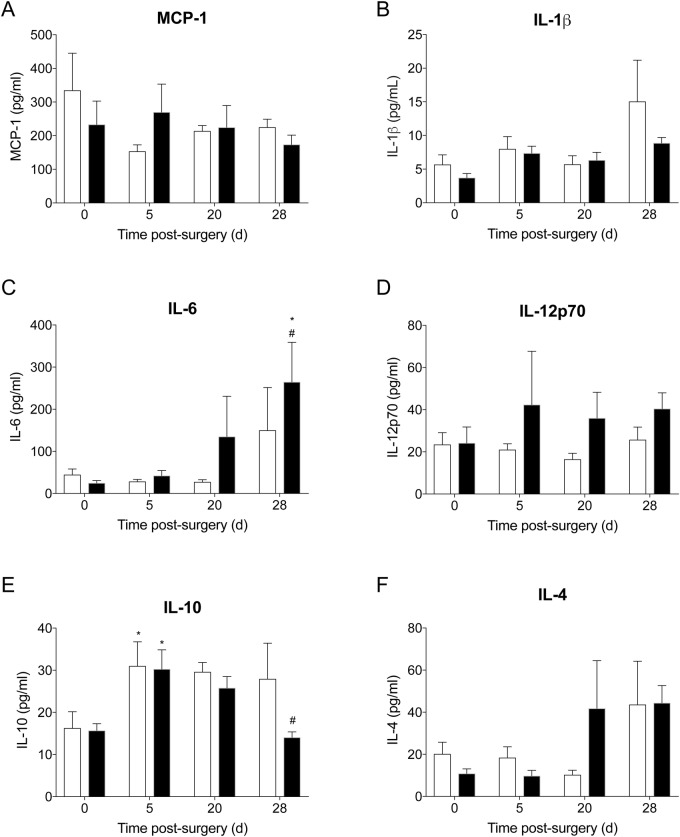
Fig. 2.
Inflammatory chemokine and cytokines in plasma of control (n=5) and infected (n=10) animals at baseline, day 5, 20 and 28 post surgery. Data show mean±s.e.m. *P<0.05 compared to baseline, #P<0.05 compared to day 5 post surgery. Between-group comparisons, two-way ANOVA with Holm-Sidak multiple comparison test. Within-group comparisons, repeated-measures one-way ANOVA with Dunnett's multiple comparison test.

