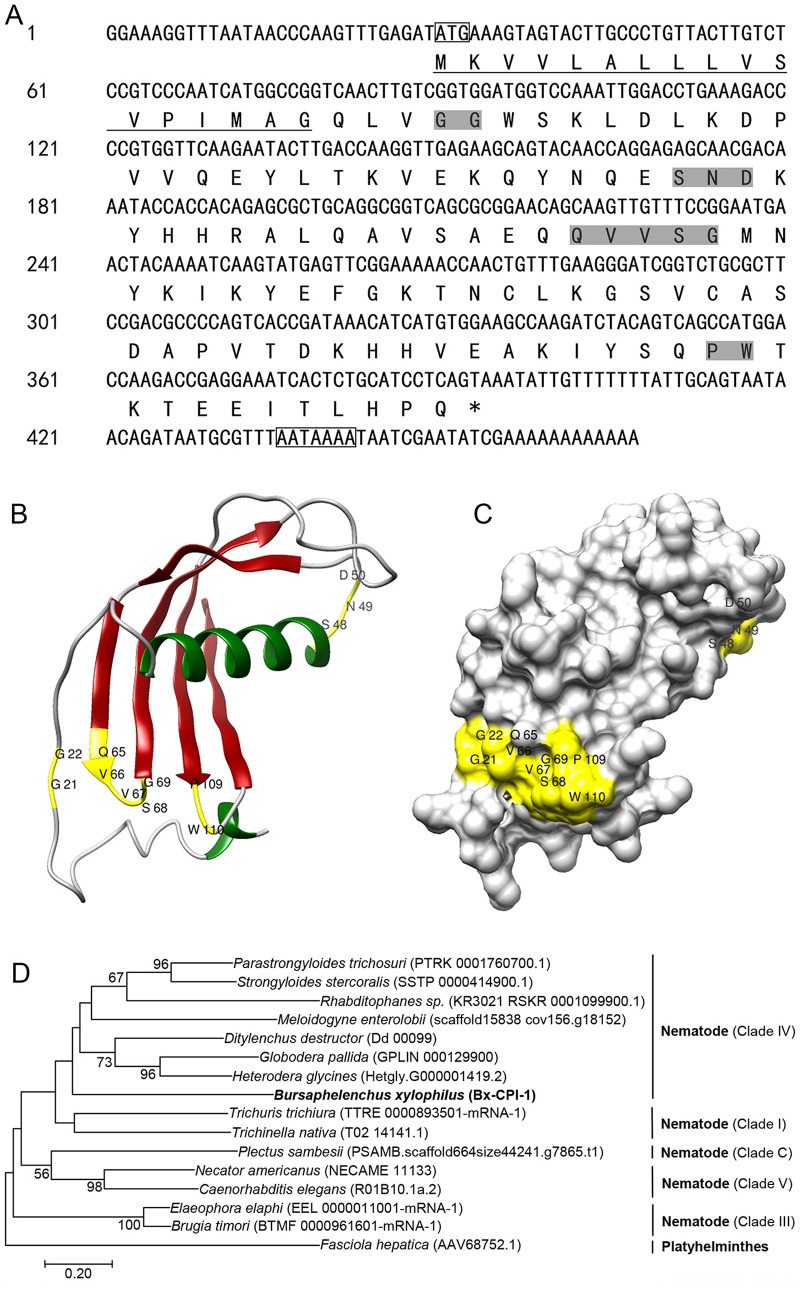
Fig. 1.
Bx-cpi-1 sequence analysis. (A) Bx-cpi-1 cDNA sequence and its deduced amino acid sequence. The start codon (ATG) and the polyadenylation signal sequences (AATAAA) are indicated in boxes; the underlined area indicates the predicted signal peptide. The highly conserved motifs (GG, SND, QVVSG and PW) are highlighted in grey, while the asterisk (*) indicates the stop codon (TAA). (B) The 3D structure comprises two alpha-helixes and five beta-strands. Motifs critical for binding to peptidases (GG, SND, QVVSG and PW) are highlighted in yellow (the numbering applies to native Bx-CPI-1). (C) Surface structures included in the 3D model. (D) Molecular phylogenetic analysis of Bx-CPI-1 by the Neighbor-Joining method. The phylogram was constructed based on amino acid sequences of 16 CPI proteins using MEGA 7.0. The numbers below the branches indicate the bootstrap values, which are calculated from 1000 replicates. Bootstrapping values are indicated as percentages (when >50%) at the branches. The evolutionary distances were computed using the Poisson correction method and are in the units of the number of amino acid substitutions per site. The accession numbers of the Nematode sequences in brackets are from WormBase ParaSite and the accession number of Platyhelminthes in brackets is from NCBI.

