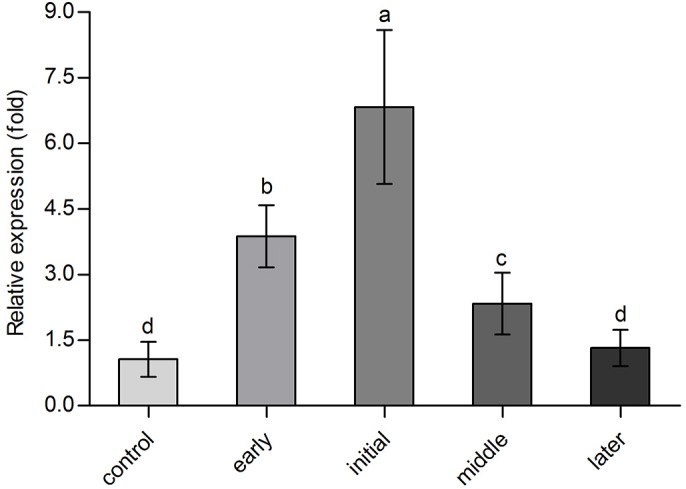
Fig. 4.

Relative expression levels of Bx-cpi-1 after inoculation. The data are presented as mean±s.d. of three biological replicates and three technical replicates (n=9). The reference gene is actin. The control group is the B. xylophilus cultivated on B. cinerea. The bars indicate s.d., and any two samples with a common letter are not significantly different (P>0.05) according to LSD tests.
