Fig. 3.
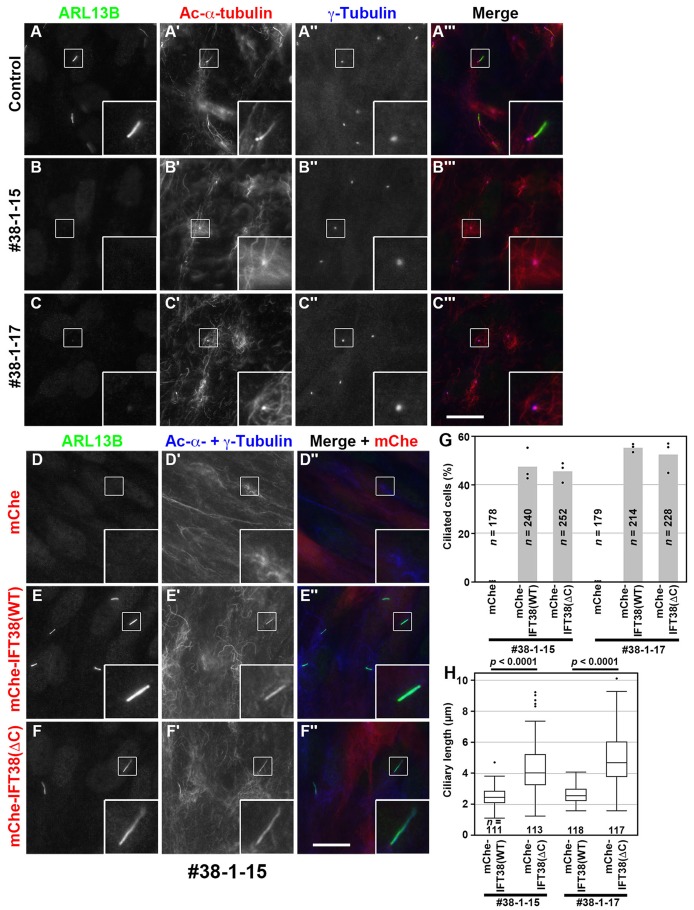
IFT38(WT) and IFT38(ΔC) differentially rescue ciliogenesis defects of IFT38-KO cells. (A–C) Control RPE1 cells and the IFT38-KO cell lines #38-1-15 and #38-1-17 were serum starved for 24 h and triple immunostained for IFT88 (A–C), acetylated (Ac)-α-tubulin (A′–C′), and γ-tubulin (A″–C″). (A‴–C‴) Merged images. (D–F) The IFT38-KO cell line #38-1-15, which stably expresses mChe (D), mChe-IFT38(WT) (E), or mChe-IFT38(ΔC) (F) were immunostained for ARL13B (D–F) and Ac-α-tubulin+γ-tubulin (D′–F′). (D″–F″) Merged images. Scale bars: 10 µm. Insets are threefold enlarged images of the boxed regions. (G) Ciliated cells of the IFT38-KO cell lines #38-1-15 and #38-1-17, which stably express mChe, mChe-IFT38(WT), or mChe-IFT38(ΔC) were counted, and percentages of ciliated cells are represented as bar graphs. The data are shown as means of three independent experiments; dots indicate the percentages of ciliated cells in individual experiments. In each set of experiments, 51–108 cells were analyzed, and the total numbers of cells analyzed (n) are shown. (H) The length of cilia in the IFT38-KO cell lines #38-1-15 and #38-1-17, which stably express mChe-IFT38(WT) or mChe-IFT38(ΔC) was measured and expressed as box-and-whisker plots. The box represents the 25–75th percentiles [interquartile range (IQR)], and the median is indicated. The whiskers show the minimum and maximum within 1.5×IQR from the 25th and 75th percentiles, respectively. Outliers are indicated with dots. The total numbers of cells analyzed (n) are shown. P-values were determined by the Student’s t-test.

