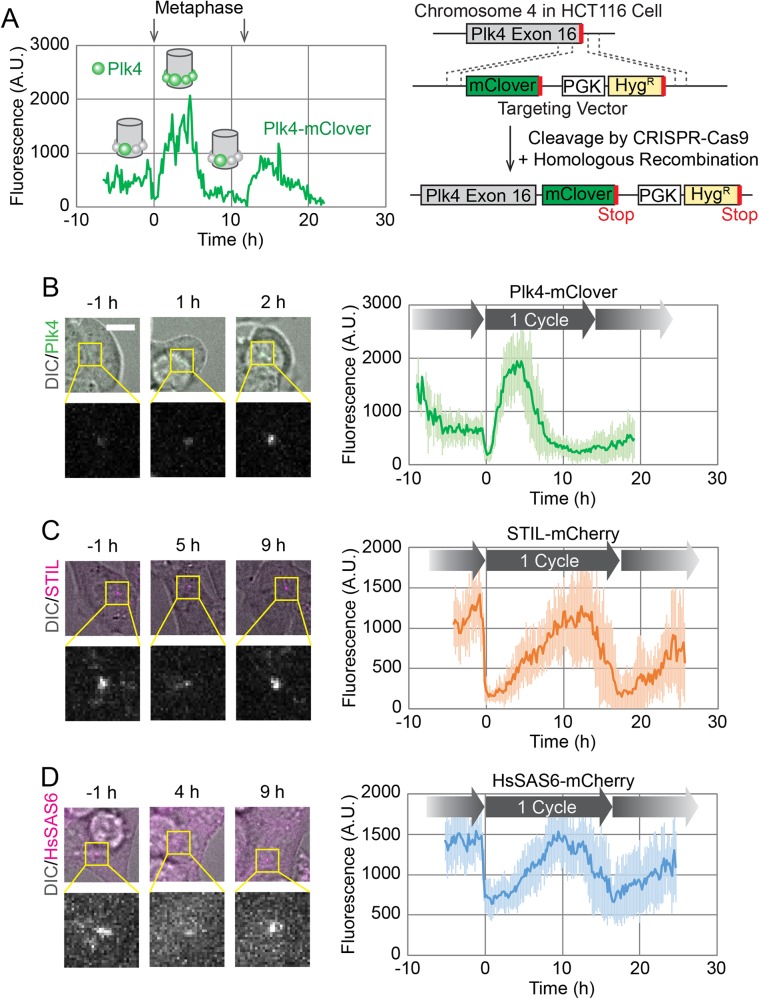
Fig. 1.
Live imaging of endogenously tagged proteins involved in centriole duplication. (A) Time course of centriolar Plk4-mClover fluorescence from a single cell. The cell divided twice during the 30 h observation period, as indicated by the arrows showing metaphase. Schematics in the graph show putative spatial patterns of Plk4 around the mother centriole at the corresponding time points. The endogenous tagging system is schematically shown on the right. (B–D) Averaged time courses of Plk4-mClover (B), STIL-mCherry (C) and HsSAS6-mCherry (D) signals at the centrioles of 14, 11 and 12 cells, respectively. Time course data were aligned at metaphase (0 h). The period between two metaphase time points is defined as one cycle. Note that the length of the cycle varies slightly among the averaged graphs due to the variety in the cell population. Representative images are shown on the left of each graph. Error bars, s.d. A.U., arbitrary units. Scale bar: 10 μm.

