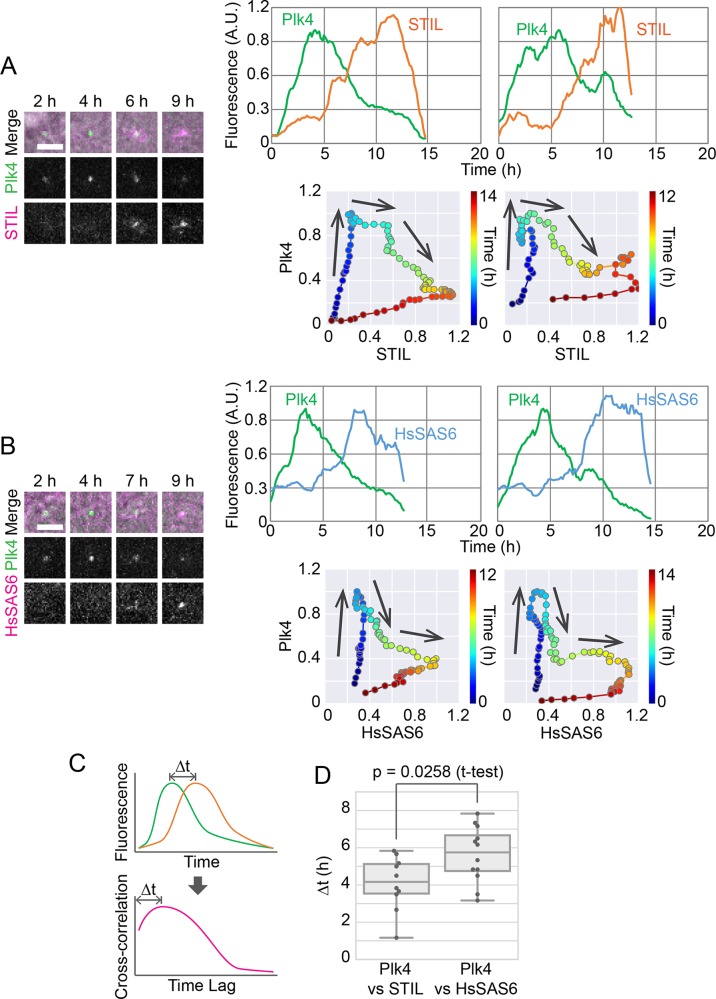
Fig. 2.
Distinct behavior of STIL and HsSAS6 relative to Plk4 in centriolar accumulation. (A,B) Simultaneous imaging of endogenously tagged Plk4 and STIL (A) or HsSAS6 (B). Representative images (left) and two example graphs (right) are shown for each. Scale bars: 5 μm. Each graph shows data from a single cell with moving-average smoothing (±3 time points). The time course of normalized fluorescence is shown in two different ways: fluorescence of each component against time (top) and against each other and time color-coded (bottom). Arrows on the graphs indicate the direction of the time course. See also Figs S3 and S4. (C,D) Cross-correlation analysis to compare the time courses of STIL-mCherry or HsSAS6-mCherry with that of Plk4-mClover. Schematics of how to obtain the time lag (Δt) based on cross-correlation (C) and obtained Δt values (D) are shown. A.U., arbitrary units.

