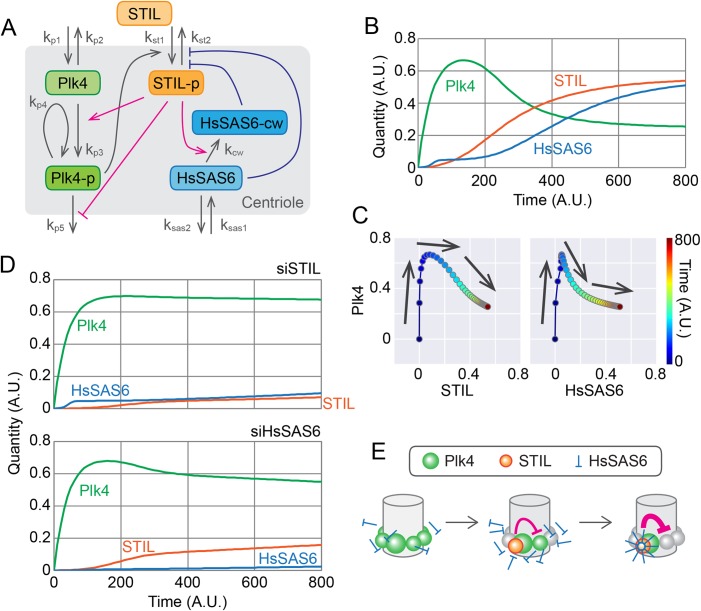
Fig. 4.
Mathematical modeling of the centriolar dynamics of Plk4, STIL and HsSAS6. (A) Schematic of the mathematical model. The definitions of rate constant k are as follows: kp1 and kp2 are the entry and dissociation rates of centiolar Plk4. kp3 and kp4 are the self- and trans-autophosphorylation rates of Plk4. kp5 is the dissociation rate of centriolar phospho-Plk4. kst1 and kst2 are the entry and dissociation rates of centriolar STIL. kcw is the rate of cartwheel assembly of HsSAS6. ksas1 and ksas2 are the entry and dissociation rates of centriolar HsSAS6. Plk4-p, STIL-p and HsSAS6-cw denote the phosphorylated forms of Plk4 and STIL, and HsSAS6 in the cartwheel structure, respectively. See the text and Materials and Methods for details. (B) Simulated time course of Plk4, STIL and HsSAS6 at a centriole. Total quantities (Plk4+Plk4-p, STIL+STIL-p, and HsSAS6+HsSAS6-cw) are shown. Note that quantity and time are all relative (dimensionless). (C) Changes in the quantity of Plk4 against that of STIL or HsSAS6. The simulation data have been plotted in the same way as in the graphs in Fig. 2. (D) Simulated effect of STIL or HsSAS6 depletion. Simulation results with the expression levels of STIL or HsSAS6 decreased to 10% and 1% of the normal levels, respectively, are shown. (E) Schematic of the model of the onset time course of procentriole formation. A.U., arbitrary units.

