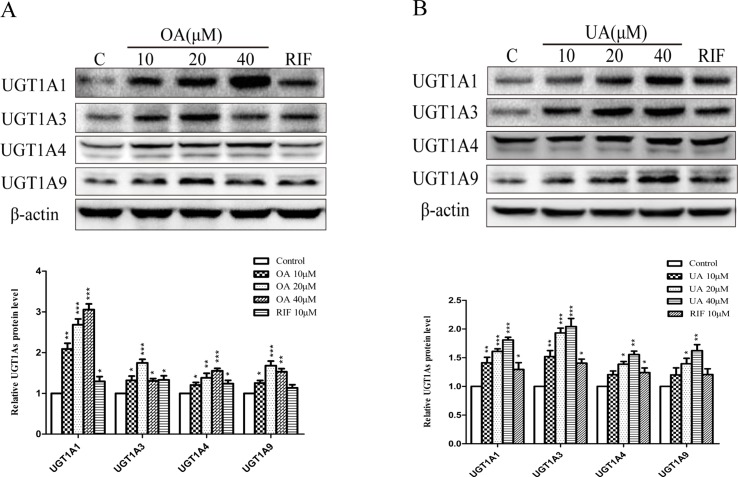
Figure 2.
Effect of OA and UA on UGT1A proteins in HepG2 cells. The effect of OA (10, 20, and 40 μM) (A) and UA (10, 20, and 40 μM) (B) on UGT1As (UGT1A1, UGT1A3, UGT1A4, and UGT1A9) protein expression in HepG2 cells was quantified by Western blotting analysis, normalized to β-actin, and compared to the control group. DMSO (0.1%) was used as negative control. RIF (10 μM) was used as the positive control. The data are expressed as the mean ± SD of triplicate independent experiments (*p < 0.05, **p < 0.01, ***p < 0.001).

