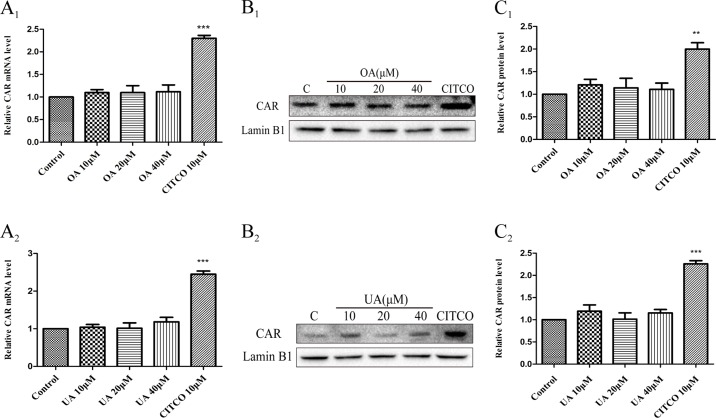
Figure 4.
Effect of OA and UA on CAR mRNA and protein in HepG2 cells. The HepG2 cells were treated with OA (10, 20, and 40 μM) (A 1–C 1 ) and UA (10, 20, and 40 μM) (A 2–C 2 ) for 24 h. Effect of OA and UA on CAR mRNA and protein expression in HepG2 cells was measured by real-time Q-PCR analysis (A) and Western blotting analysis (B–C). The determination of mRNA and nuclear protein was normalized to GAPDH and Lamin B1, respectively. DMSO (0.1%) was used as the negative control. CITCO (10 μM) was used as the positive control. The data are expressed as the mean ± SD of triplicate independent experiments (**p < 0.01, ***p < 0.001).

