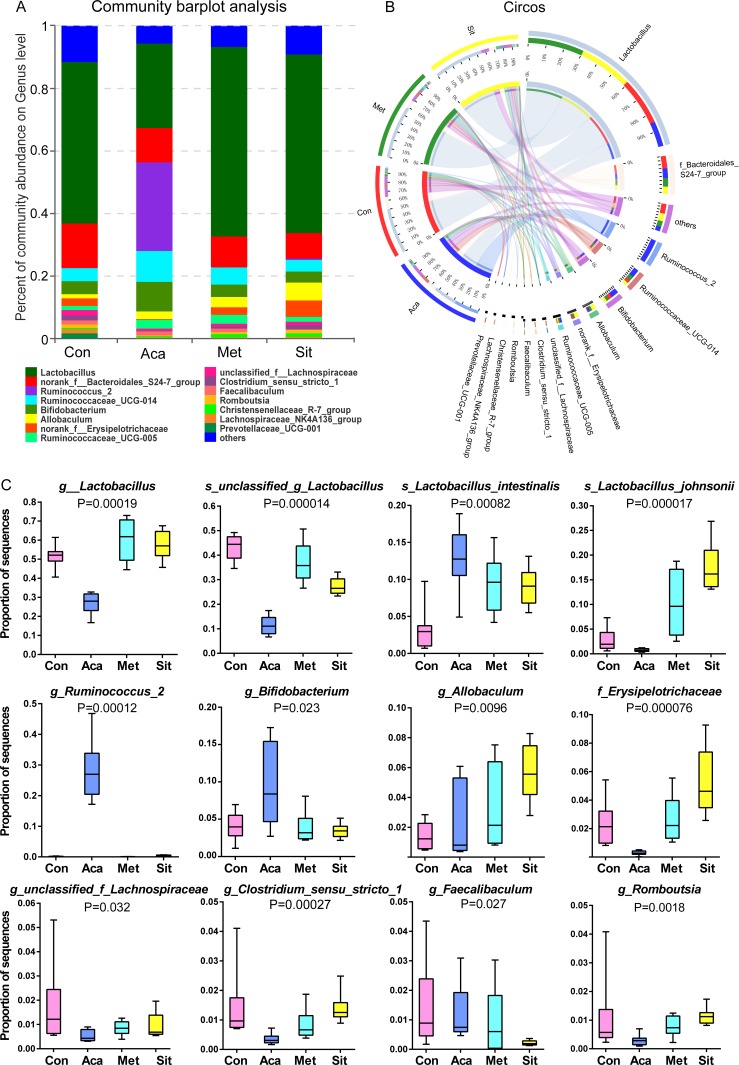
Figure 4.
Bacterial community abundance on specific taxa of each group. (A) Community barplot analysis showing the relative abundance on top 15 abundance genera. (B) Circos plot displaying the relationship between samples and bacterial genera. (C) Relative abundance of genus and specific species significantly altered by hypoglycemic agents.

