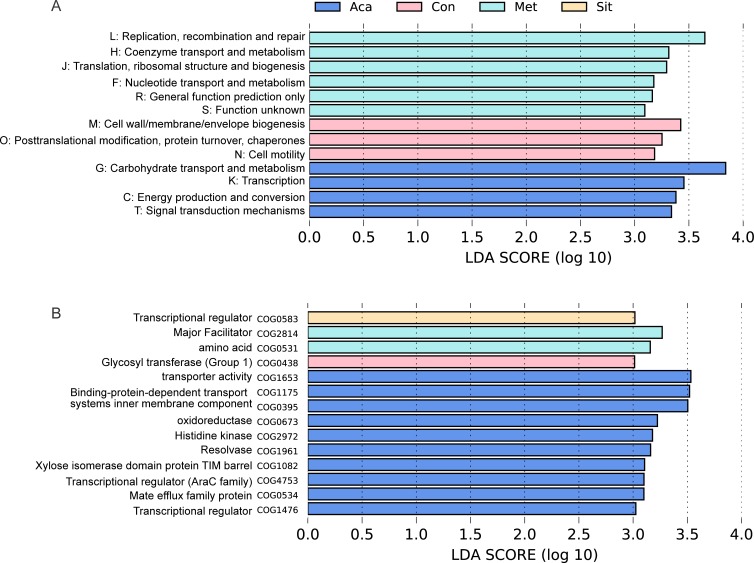
Figure 6.
Functional profilings in metagenomic predictions by using Phylogenetic Investigation of Communities by Reconstruction of Unobserved States (PICRUSt) and LDA effect size (LEfSe) analysis. LEfSe barplot showing different abundance of (A) clusters of orthologous groups (COG) functional classifications and (B) COG secondary classifications among control (Con), acarbose (Aca), metformin (Met) and sitagliptin (Sit) groups. They were annotated in evolutionary genealogy of genes: Non-supervised Orthologous Groups (eggNOG) database. Only log linear discriminant analysis (LDA) >3 was shown.

