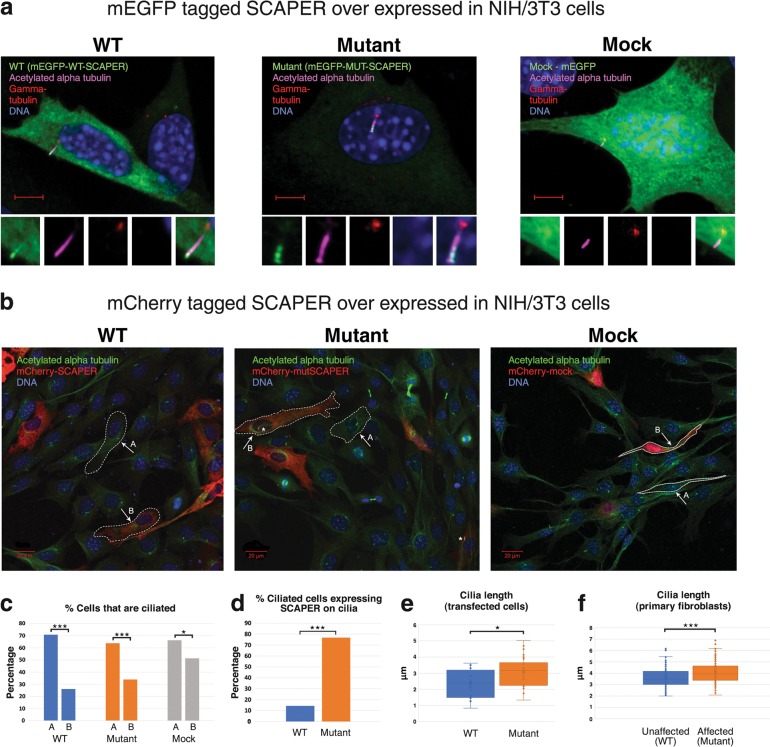
Fig. 3.
SCAPER localization and ciliary phenotype in NIH/3T3 cells and cilia length in primary fibroblasts: a Exogenous SCAPER tagged with mEGFP localizes to the primary cilia: NIH/3T3 cells transfected with mEGFP-WT/MUT-SCAPER plasmids (over-expressing wild type or mutant p.(L936*) SCAPER, N′-tagged with mEGFP, shown in green), and stained for visualization of primary cilia and the basal body using anti acetylated alpha tubulin antibody (magenta) and anti-gamma tubulin antibody (red); logarithmic presentation (γ = 2), enabling identification of cilia axoneme (magenta) and basal body (red); DNA stained with DAPI (blue). Scale bar = 5 µm. Small panels, zooming on the primary cilia, demonstrate (left to right): mEGFP (green), Acetylated alpha tubulin (magenta), gamma tubulin (red), DAPI (blue) and overlay of all the above (ZEISS LSM880 microscope, 60×/1.4 objective). b Exogenous SCAPER tagged with mCherry localizes to the primary cilia as well: the experiments above were repeated with SCAPER N′-tagged with mCherry, with results similar to those in Fig. 3a. Acetylated alpha tubulin (ciliary axoneme) marked in green. As most cells were not dividing, low transfection rate and high percentage of ciliated cells was achieved in all experiments. Larger fields are presented: “A” and “B” mark the sub-populations of naïve (un-transfected) cells and transfected cells within each field studied, respectively. Asterisks mark primary cilia with SCAPER (in red) localized to it (ZEISS LSM880 microscope, 20×/0.8 objective). c Percentage of naïve (A) and transfected (B) cells that are ciliated: Lower percentage of ciliated cells was noticed in all experiments among transfected cells, compared to non-transfected cells. The difference was less marked with mock mCherry and mEGFP (66% of ciliated cells in the naïve sub-population; 51% of ciliated cells in the transfected cells; n = 145 and 72, respectively; p = 0.035), as compared with overexpression of wild-type SCAPER (71% vs. 26%; n = 792 and 188; p < 0.001), and mutant SCAPER (64% vs. 34%, n = 613 and 165, p < 0.001). d Percentage of ciliated transfected cells in which SCAPER localized to cilia: Within the sub-population of cells that were both transfected and ciliated, SCAPER could seldom be found localized to the primary cilia in cells over-expressing WT SCAPER (14%, n = 49), while the mutant protein was constantly observed in the primary cilia (77%, n = 56; p < 0.001). The mock transfectants did not demonstrate any specific localization. e Quantification of cilia length in transfected cells: WT cilia were shorter than the mutants; lengths (mean) were 2.34 µm and 3.07 µm, respectively (n = 16, n = 30, respectively; p = 0.013; only cells visualized with X60/1.2 objective were measured). f Quantification of cilia length in primary non-transfected skin fibroblasts of mutant (affected, patient P2:IV1) versus wild type (healthy control) individuals: WT cilia were shorter than the mutant cilia; lengths (mean) calculated were 3.62 µm and 4.09 µm, respectively (3 technical repeats, n = 119, n = 113, respectively; p = 0.00019; further details in Methods and in supplementary figure 1). All NIH/3T3 transfected cells were assayed 16–24 h post transfection

