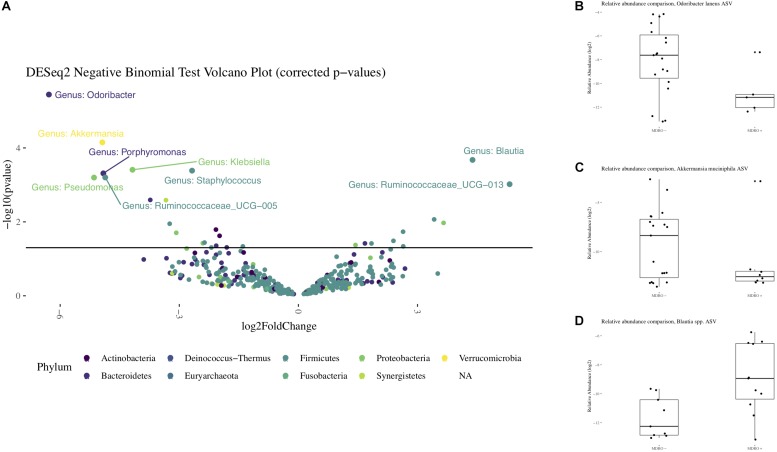
FIGURE 6.
Differential representation of taxa from the 16S rRNA amplicon sequencing. Panel (A) Volcano plot with differentially abundant features observed between subjects who acquired MDRO or not (MDRO+ or MDRO-, respectively). Only features whose relative abundances remained significantly different after correcting for multiple comparisons are labeled (FDR < 5%). A negative log2 Fold Difference in relative abundance indicates the feature predominated among MDRO-, and vice versa for MDRO+. Panels (B–D). Boxplots with the relative abundances of Odoribacter laneus, Akkermansia muciniphila and Blautia spp. among MDRO- and MDRO+ subjects. MDRO, multidrug-resistant organisms; FDR, false discovery rate.

