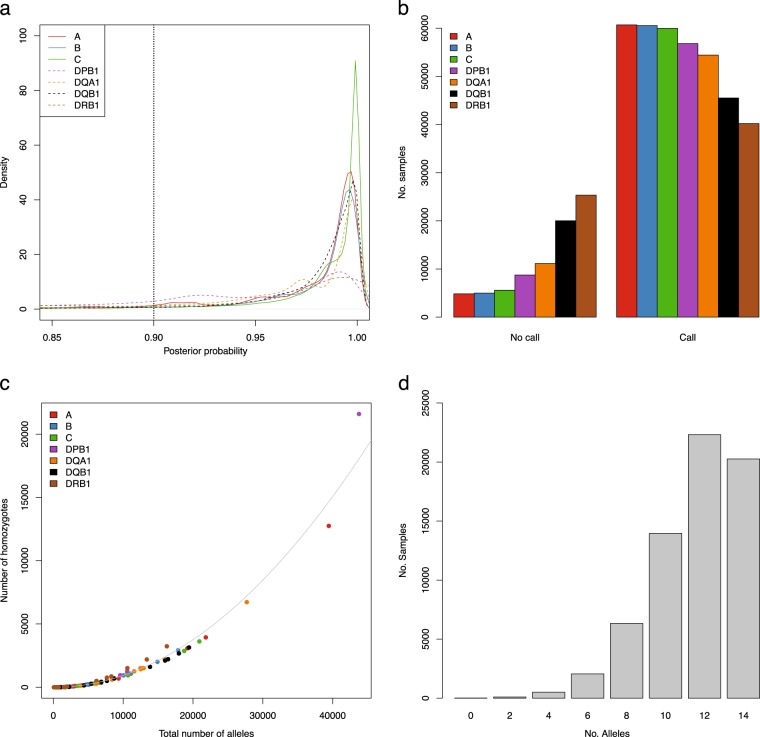
Fig. 2.
Imputation of HLA alleles. a Posterior probability densities per HLA locus from HIBAG imputation. HLA class I are solid lines, HLA class II loci are represented as dotted lines, vertical dotted line at 0.90 represents filtering threshold. Color coding: A: red, B: blue, C: green, DPB1: magenta, DQA1: orange, DQB1: black and DRB1: brown. b Number of samples that were removed (no call) or kept (call) for the seven HLA loci, color coding as in (a). c Correlation between the total number alleles called and the number of homozygous individuals for a given allele. Each allele is color coded according the locus, color as in (a). d Number of alleles called per sample after filtering for posterior probability. The maximum number of alleles that can be called per sample across all seven loci is 14

