Fig. 4.
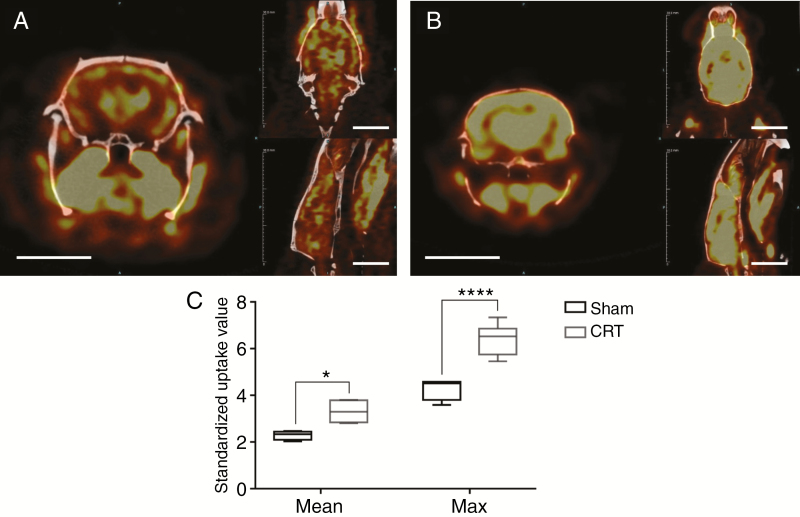
PET imaging at 12 months after cranial radiotherapy (CRT) demonstrate changes in metabolic activity in the brain. Metabolic imaging of (A) Sham animal and (B) CRT animals with 18F-FDG-PET. A heat map of glucose uptake is shown where the color yellow indicates higher uptake. (C) Glucose uptake was quantified using standardized uptake value (SUV) of the entire brain volume. Mean and Max SUV was higher in CRT brains than Sham. Scale bar = 10 mm, *P ≤ .05, ****P ≤ .0001.

