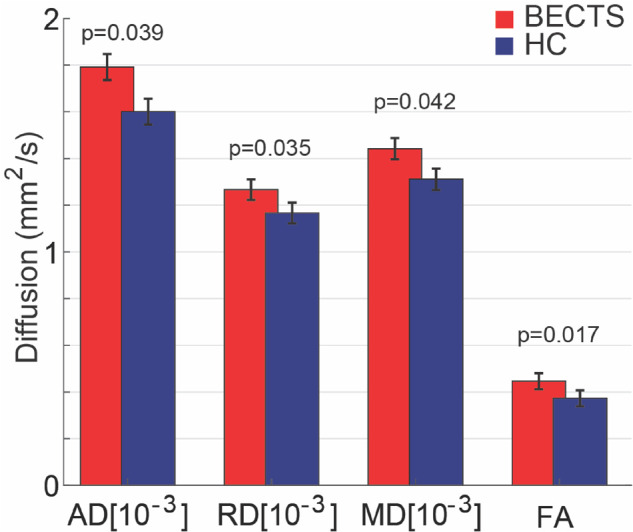
Figure 3.

Perirolandic u-fibre microstructural characteristics differ in BECTS and HCs. BECTS subjects had increased diffusivity (AD, RD, MD) and FA in the white matter adjacent to the seizure onset zone compared with HCs. Bars (vertical lines) indicate mean (standard deviation) for each measure. (Note that FA is unitless.)
