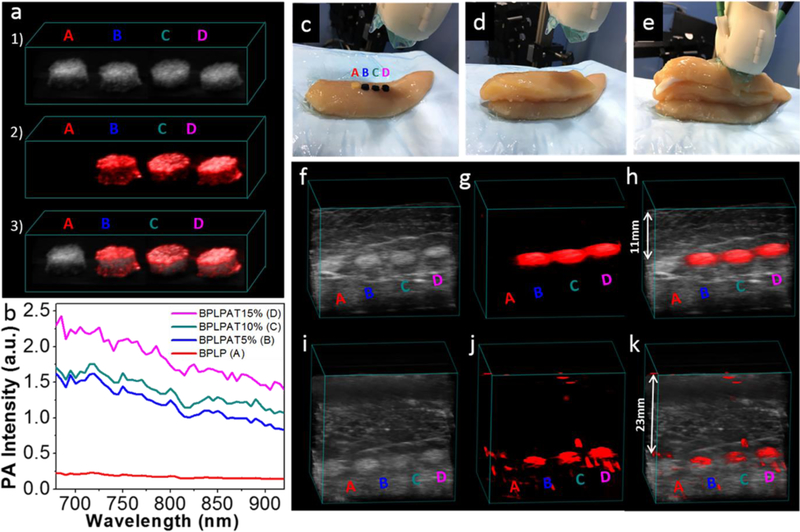
Figure 6.
PA imaging of BPLP and BPLPAT scaffolds. (a) (1) Ultrasound images, (2) PA images, and (3) superimposed ultrasound and PA images of BPLP and BPLPAT scaffolds embedded inside agar gel. (b) PA intensity of BPLP and BPLPAT scaffolds. (c), (d), and (e) Experiment setup for deep tissue PA imaging of BPLP and BPLPAT scaffolds. (f) Ultrasound images, (g) PA images, and (h) superimposed ultrasound and PA images of BPLP and BPLPAT scaffolds covered under a ~11 mm thick layer of chicken breast tissue. (i) Ultrasound images, (j) PA images, and (k) superimposed ultrasound and PA images of BPLP and BPLPAT scaffolds covered under two layers thick (total ~23 mm thick) of chicken breast tissue.

