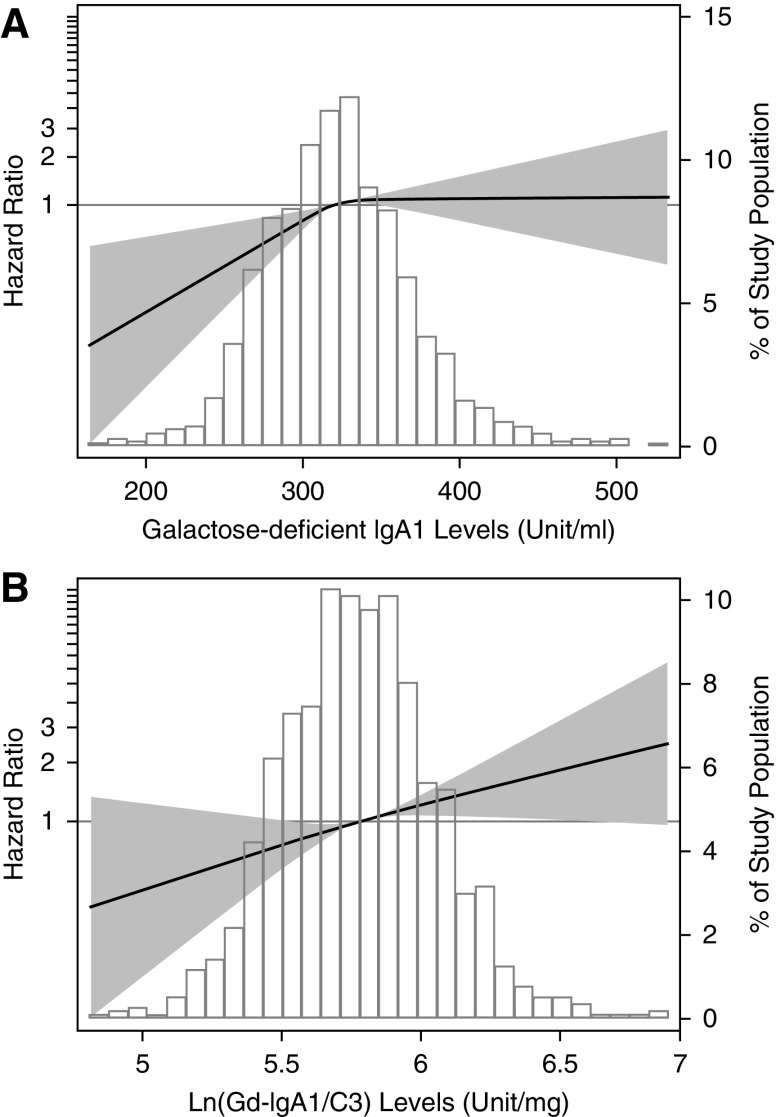
Figure 1.
Associations of plasma galactose-deficient IgA1 concentration and plasma galactose-deficient IgA1/C3 ratio with CKD progression. Models were performed using restricted cubic splines with knots at the 25th, 50th, and 75th percentiles. The reference value was set at the medians. The solid line represents the estimated hazard ratio, the shaded area represents the 95% confidence bands, and the histogram represents the distribution of galactose-deficient IgA1/C3 ratio in participants with IgA nephropathy. Models were adjusted for age; sex; eGFR; proteinuria; hypertension; Oxford M (mesangial hypercellularity score), E (the presence of endocapillary proliferation), S (segmental glomerulosclerosis/adhesion), T (severity of tubular atrophy/interstitial fibrosis), and C (presence of crescent) scores; and corticosteroids/immunosuppressive therapy. Gd-IgA1, galactose-deficient IgA1; ln, natural log transformation.

