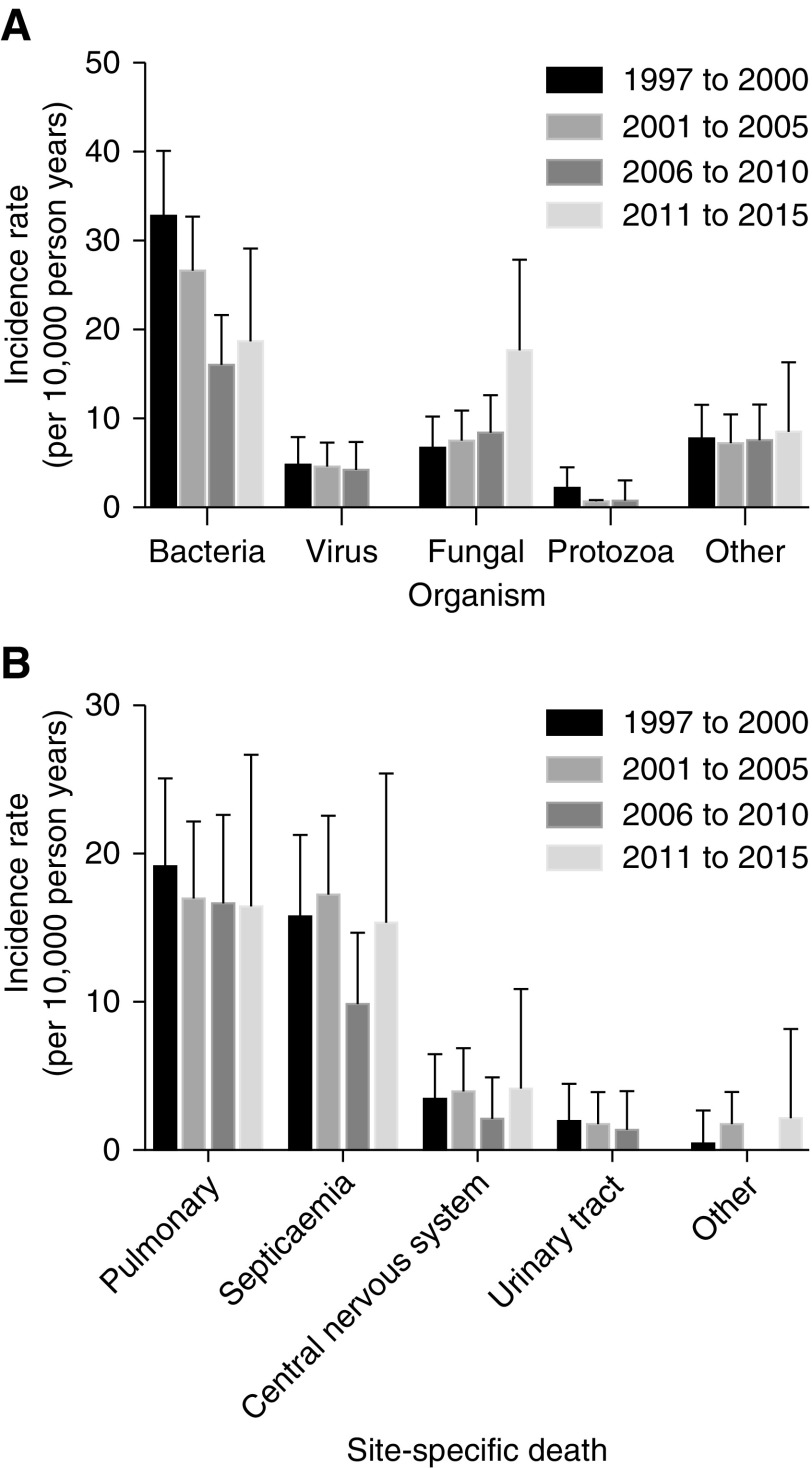
Figure 3.
Incidence of infection-related mortality for study period (1997-2015) by transplant era. (A) Incidence of organism-specific mortality for study period by transplant era. (B) Incidence of site-specific death for study period by transplant era. Errors bars depict the upper 95% confidence limits.

