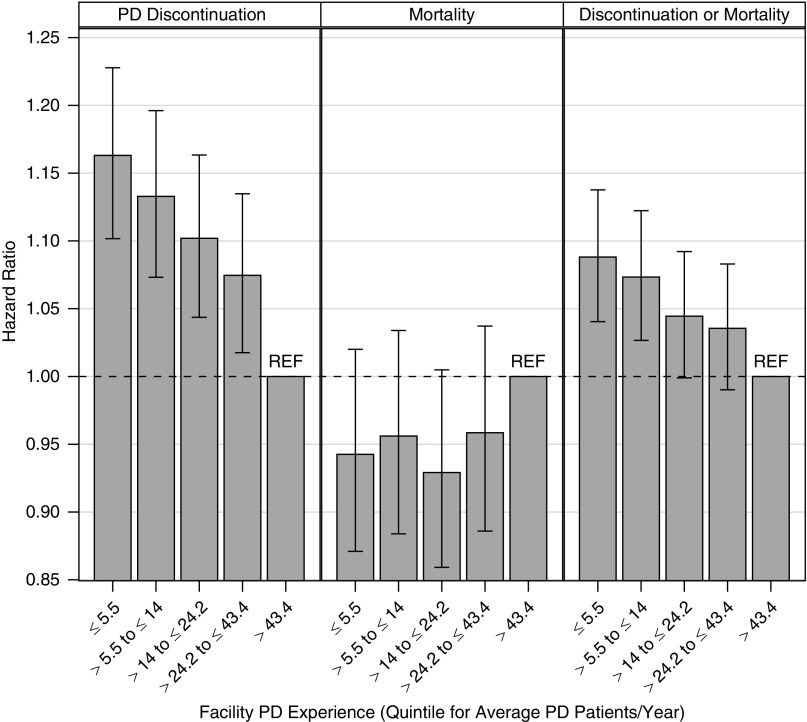
Figure 2.
Associations between facility PD experience and PD patient outcomes. On the basis of a Cox proportional hazards model with adjustment for time period (in 6-month intervals) and the factors shown in Table 3. The error bars display 95% confidence intervals. The experience quintiles, expressed as average patients per year, are quintile 1 (0, 5.5), quintile 2 (5.5, 14), quintile 3 (14, 24.2), quintile 4 (24.2, 43.4), and quintile 5 (43.4+).

