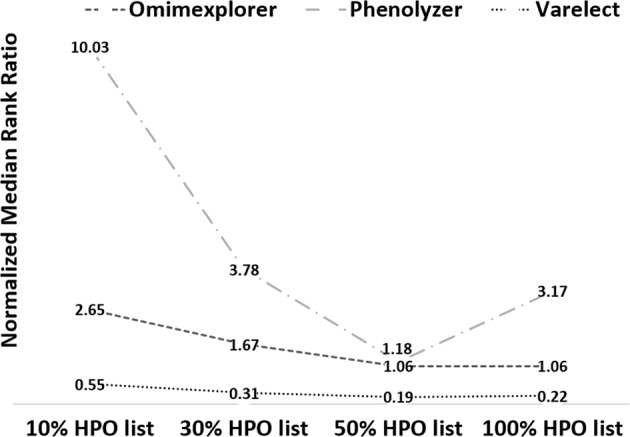
Fig. 3.

Median rank ratio distribution using partial HPO terms across three gene prioritization tools. The median rank ratio values obtained across all partial HPO-based analysis (10% HPO, 30% HPO, 50% HPO, and full list of HPO) are depicted for each of the three tools studied. The values have been normalized (by 100) for graphical representation
