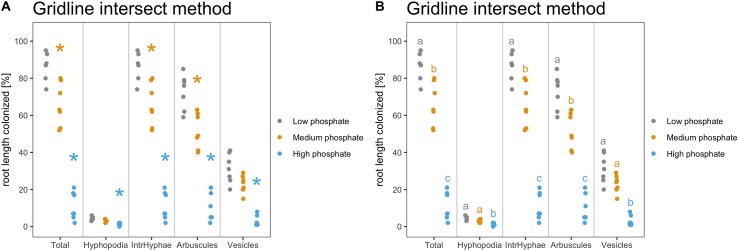
Figure 6.
Indication of statistically significant differences on the plot. Strip chart containing indications of statistically significant differences. (A) The asterisks compare the treated samples against the control. Plot with Kruskall Wallis test followed by “Bonferroni Hochberg” correction and p value threshold set to 0.01. (B) Same statistical test as in (A) but different letters indicate different statistical groups. (A, B) All statistical comparisons have been performed per variable and not across variables to account for the biological meaning of the comparison. For example, the asterisks and letters present in the section “Total” have only a meaning for “Total” and cannot be compared with the asterisks from the other sections.

