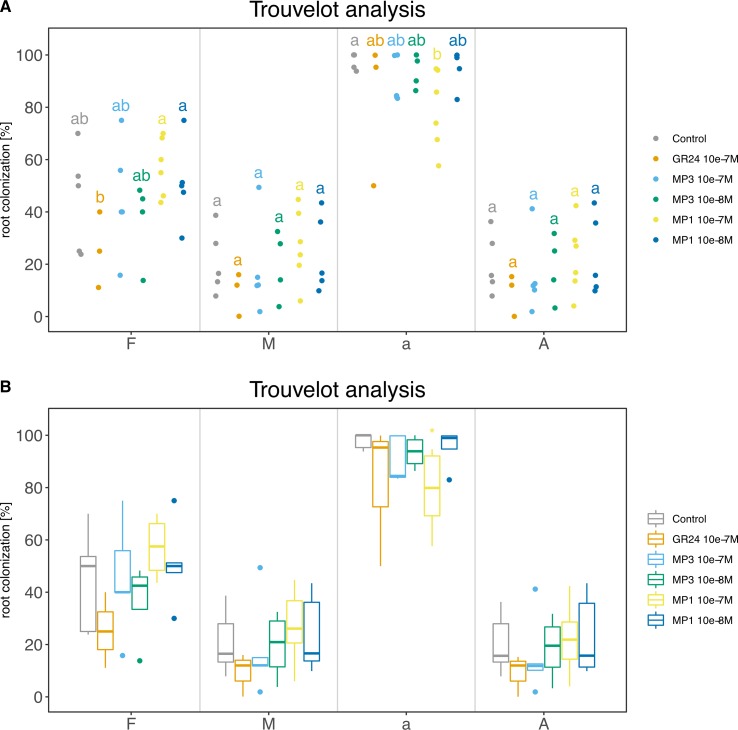
Figure 8.
Trouvelot analysis method. The two plots display the same data in two different flavors: (A) strip chart with letters to indicate statistical groups and (B) box-whisker plot with asterisks to indicate statistical difference compared to the control. Bold black line, median; box, interquartile range; whiskers highest and lowest data point within 1.5 interquartile range; dots, outliers outside the 1.5 times the interquartile range. (A, B) Compounds used: GR24; MP (Methyl phenlactonoate) 1 and 3. Kruskall-Wallis test with no correction method and p < 0.05 was used to assess statistical differences between samples.

