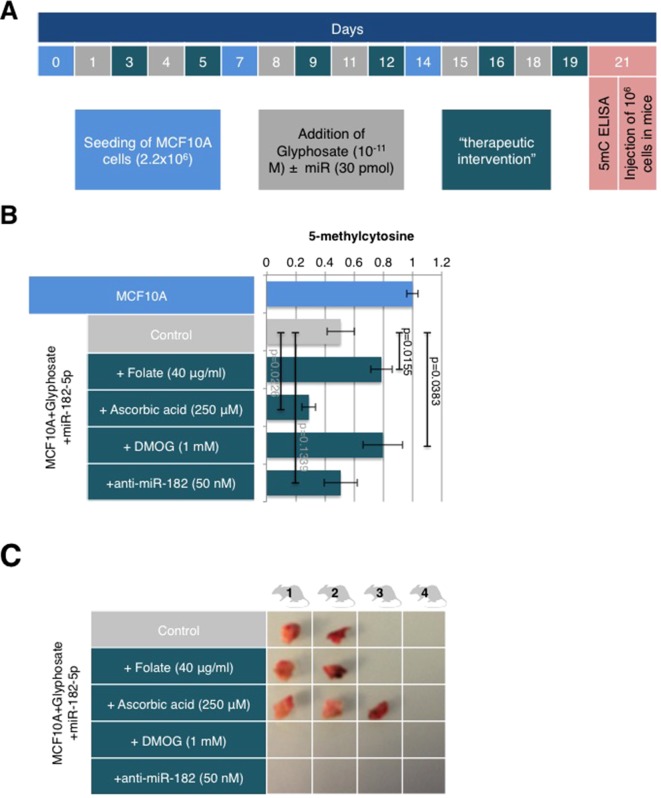
Figure 4.
DMOG and anti-miR-182 prevent tumor onset but differentially impact 5-meC level. (A) The timetable illustrating the experiment design. Explanations for color-coded days are located in corresponding color rectangles underneath the timeline. Therapeutic interventions on MCF10A cells treated with glyphosate and miR as indicated were performed on days 3, 5, 9, 12, 16, and 19 with folate (40 μg/ml), ascorbic acid (250 μM), DMOG (1 mM), or anti-miR-182 (50 nM). (B) MCF10A cells were treated as shown in schedule A. DNA was extracted at day 21 and used in 5mC ELISA. The bar graph illustrates the levels of 5mC for the different conditions. (C) Mice were injected with the cells following the treatment schedule A and euthanized 21 days later. Shown are pictures of the resected tumors.

