Figure 5.
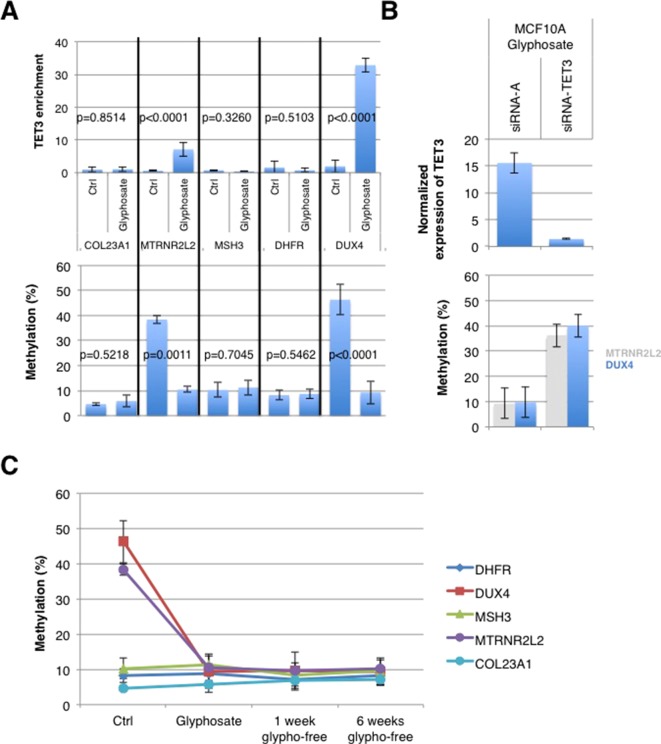
Glyphosate-induced TET3-mediated demethylation affects MTRNR2L2 and DUX4 genes. (A) MCF10A cells were treated with glyphosate for 21 days as in the schedule shown in Figure 2. The graphs illustrate TET3 enrichment (top) following chromatin immunoprecipitation (ChIP) and the methylation level measured by qMSRE (bottom) of five genes defined by the ChIP atlas as being TET3-targeted genes. (B) MCF10A cells were treated with glyphosate for 21 days (according to the timetable of Figure 2), with siRNA added concomitantly to glyphosate. Bar graph (top) of TET3 expression measured with In-Cell ELISA after treatment with siRNA-TET3 (sc94636) or control siRNA-A (sc94636). Normalization to Janus Green staining intensity was performed to account for differences in cell seeding density. Bar graph (bottom) of methylation levels of DUX4 and MTRNR2L2 genes as measured by qMSRE. (C) MCF10A cells were treated with glyphosate for 21 days (glyphosate) according to the schedule shown in Figure 1 and then cultured in glyphosate-free medium for another 1 (1 week glypho-free) or 6 (6 weeks glypho-free) weeks. Shown is the graph of the methylation level of five TET3-dependent genes. “Ctrl” represents MCF10A cells without glyphosate exposure.

