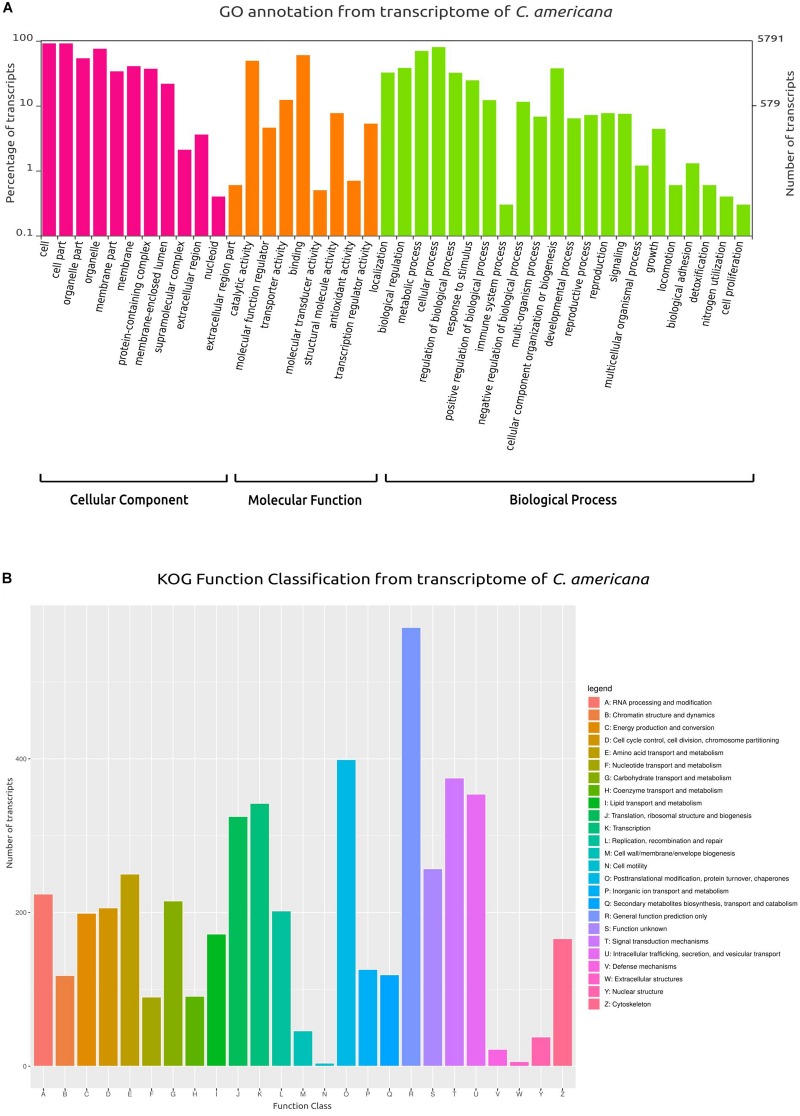
FIGURE 4.
Gene Ontology (GO) and Clusters of Orthologous Groups (KOG) plots. (A) Classification and functional distribution of the inferred proteome from the transcriptome of C. americana, according to the three major hierarchical Gene Ontology terms: Biological Process, Molecular Function, and Cellular Component. Obsolete terms and values ≤ 0.2% were not represented. (B) Distribution of KOG annotation of transcripts related to A–Z classes.

