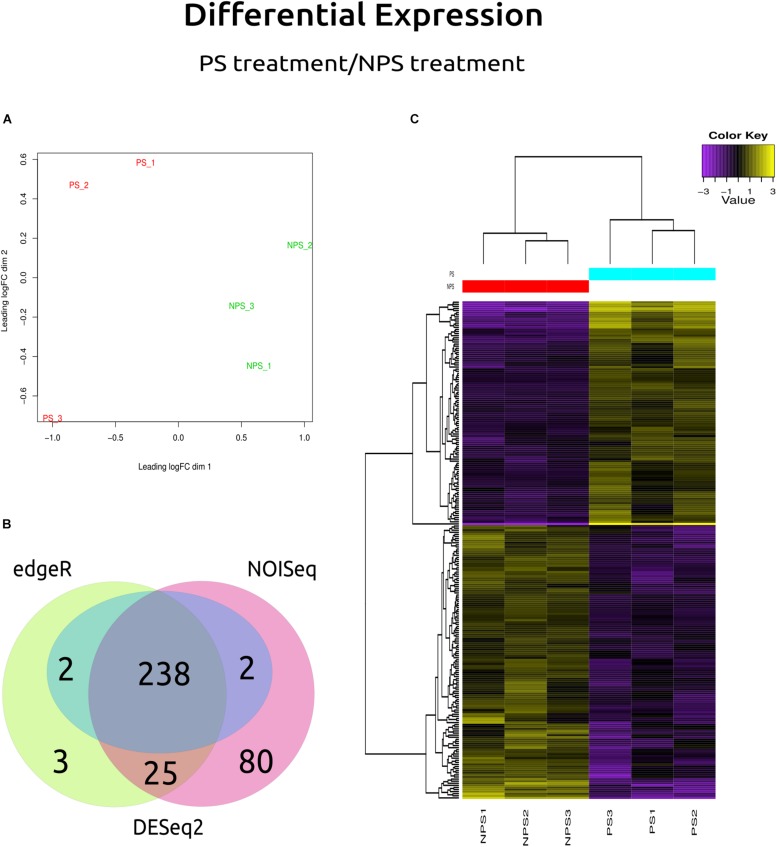
FIGURE 5.
Differential gene expression results. (A) MDS plot: Multidimensional Scaling plot shows variation among RNA-Seq samples, distance between sample labels indicates dissimilarity. (B) The Venn diagram shows the genes that were reported by each method in a particular way (DESeq2, NOISeq, EdgeR, or DESeq), and which were reported by all (those shown at the center). (C) Heatmap: yellow color denotes a high level of expression, while purple indicates low expression, NPS1, NPS2, and NPS3 denote the biological replicates for samples without (+)-α-pinene, while PS1, PS2, and PS3 denote the three biological replicates with (+)-α-pinene.

