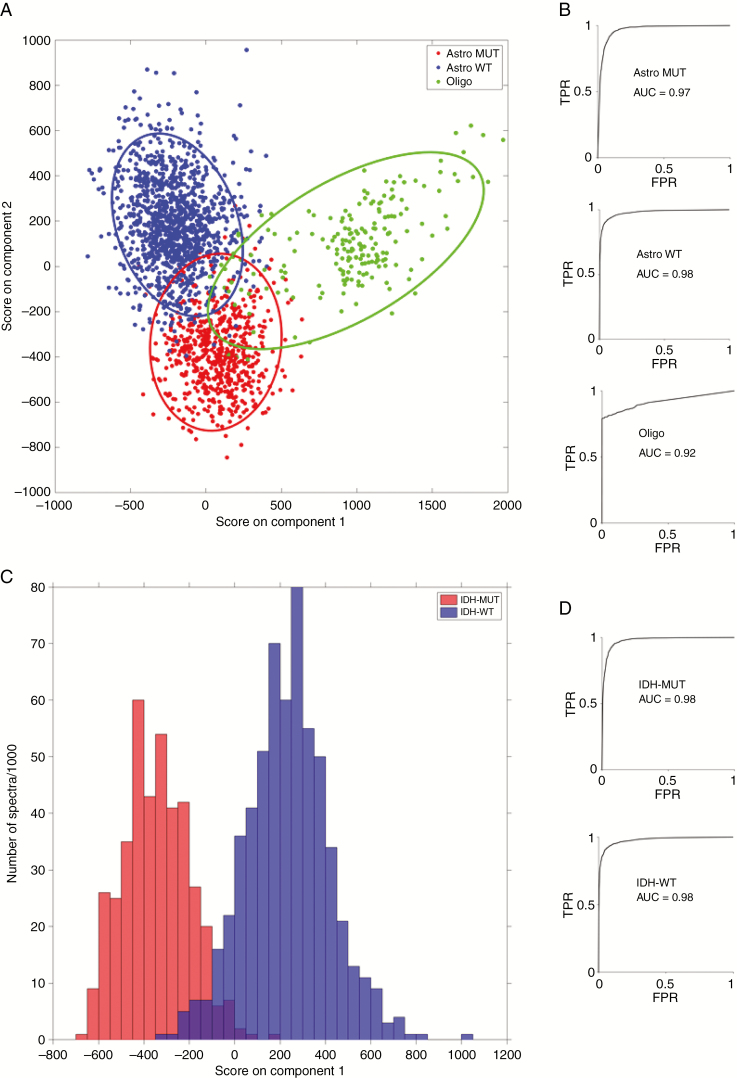
Figure 3.
Fresh tissue linear discriminant analysis score plots and receiver operating characteristic curves for 3-group model (A and B) and 2-group model (C and D). (TPR = true positive rate; FPR = false positive rate; Astro MUT = astroglial tumor isocitrate dehydrogenase [IDH]-mutant; Astro WT = astroglial tumor, IDH-wild-type; Oligo = Oligodendroglioma).

