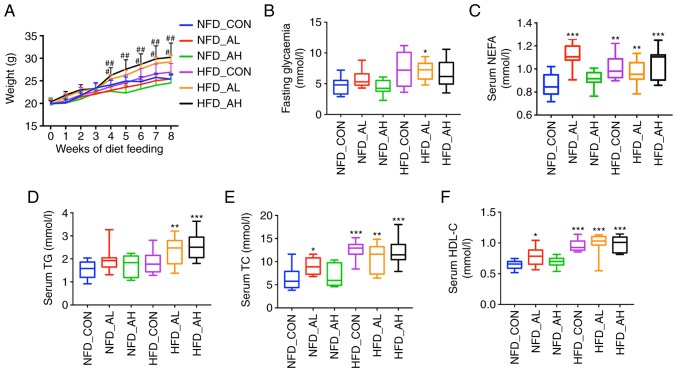
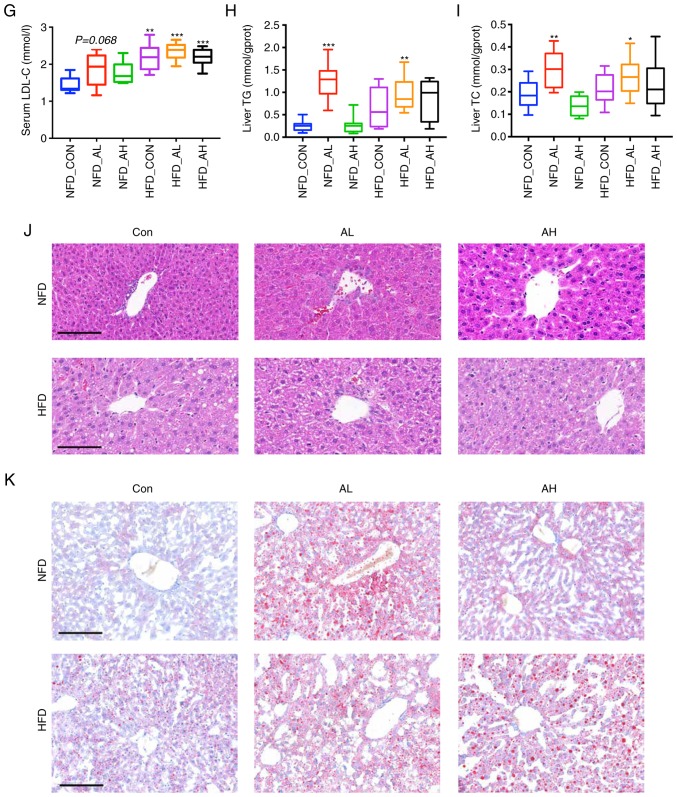
Figure 1.
Effect of DADS on lipid metabolism. (A) Effect of DADS and diet groups on the weight of the mice. (B) Effect of DADS on FBG. (C) Effect of DADS on serum NEFA. (D) Effect of DADS on serum TG. (E-G) Effect of DADS on serum TC, HDL-C and LDL-C. (H and I) Effect of DADS on liver TG and TC. (J) Hematoxylin and eosin staining of the liver of the 6 groups of mice. (K) Oil-red O staining of the 6 groups of mice. Scale bar, 80 μm. #P<0.05, ##P<0.01 vs. HFD-CON; *P<0.05, **P<0.01, ***P<0.001 vs. NFD-CON. NFD-CON, control mice fed with NFD; NFD-AL, mice fed with NFD and treated with a low dose of DADS; NFD-AH, mice fed with NFD and treated with a high dose of DADS; HFD-CON, the control mice fed with HFD; HFD-AL, mice fed with HFD and treated with a low dose of DADS; HFD-AH, mice fed with HFD and treated with a high dose of DADS. NFD, normal food diet; HFD, high fat diet; DADS, diallyl disulfide; NEFA, non-esterified free fatty acids; TG, triglyceride; TC, total cholesterol; HDL-C, high density lipoprotein-cholesterol; LDL-C, low density lipoprotein-cholesterol; FBG, fasting blood glucose.


