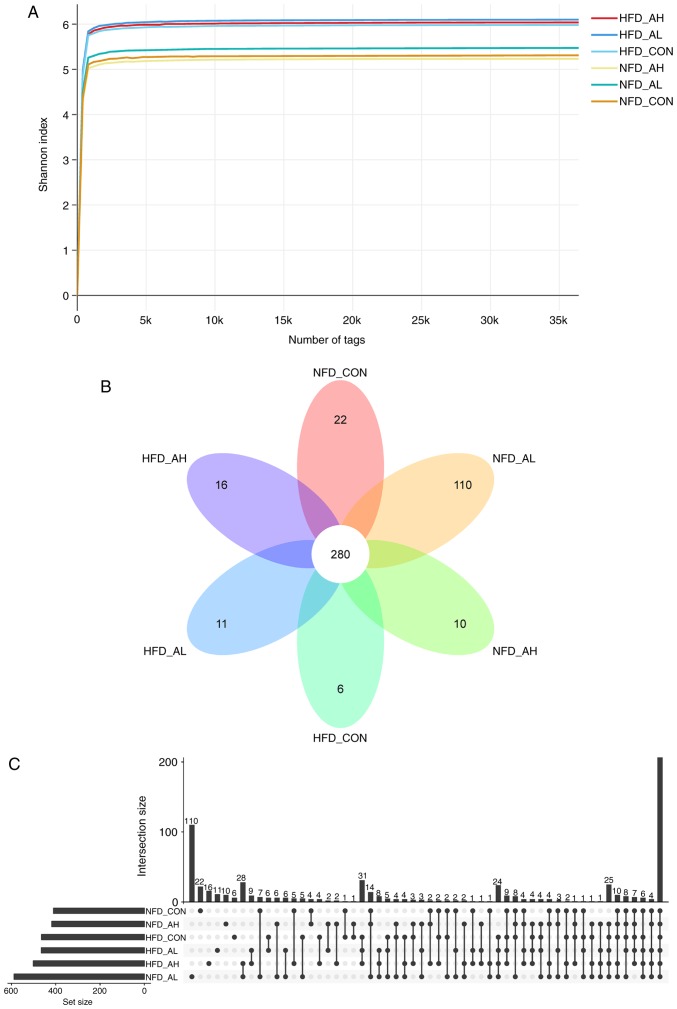
Figure 4.
Overview of the 16S rDNA gene analysis. (A) Shannon rarefaction curves for each group. (B and C) Distribution of OTUs in the six groups. NFD-CON, control mice fed with NFD; NFD-AL, mice fed with NFD and treated with a low dose of DADS; NFD-AH, mice fed with NFD and treated with a high dose of DADS; HFD-CON, control mice fed with HFD; HFD-AL, mice fed with HFD and treated with a low dose of DADS; HFD-AH, mice fed with HFD and treated with a high dose of DADS. NFD, normal food diet; HFD, high fat diet; DADS, diallyl disulfide.

