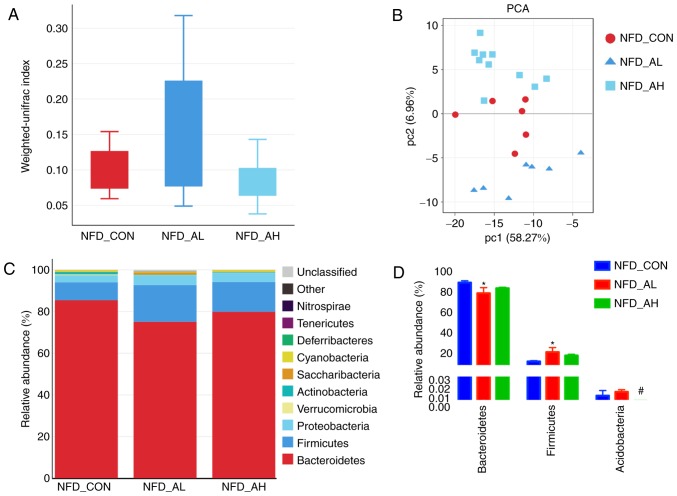
Figure 5.
Unifrac analyses, relative composition and heat map of the dominant bacterial family of the gut microbiota in the NFD groups. (A and B) Unifrac analyses. (C and D) Relative composition of the gut microbiota at the bacterial phylum level. *P<0.05 vs. NFD_CON, #P<0.05 vs. NFD_AL. NFD-CON, control mice fed with NFD; NFD-AL, mice fed with NFD and treated with a low dose of DADS; NFD-AH, mice fed with NFD and treated with a high dose of DADS. NFD, normal food diet; DADS, diallyl disulfide.

