Figure 5.
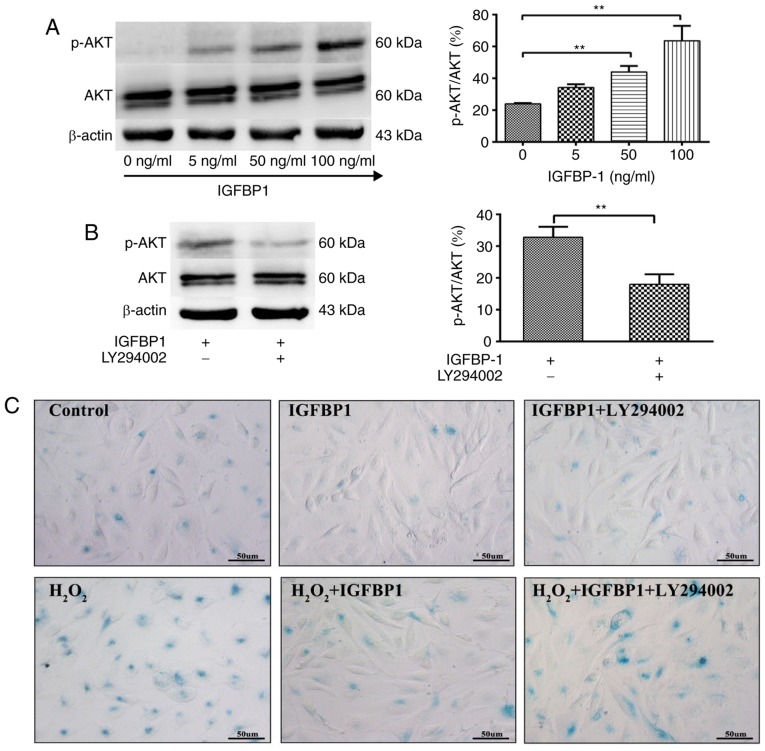
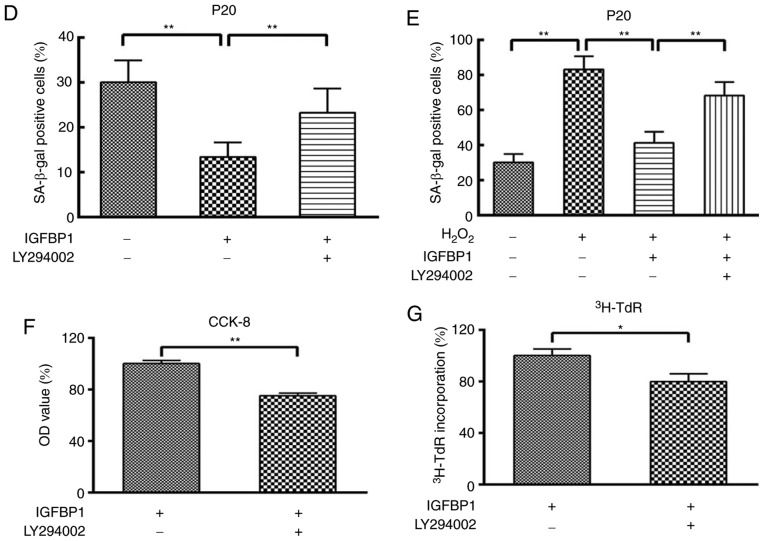
IGFBP1 regulates the senescence and proliferation of HCAECs through AKT signaling. (A) Western blot detection of AKT, p-AKT and β-actin in HCAEC 48 h after treatment with IGFBP1 (0, 5, 50 and 100 ng/ml). (B) Western blot detection of AKT, p-AKT and β-actin in HCAEC treated with IGFBP1 (50 ng/ml), or IGFBP1 (50 ng/ml) plus LY294002 (10 μmol/l) for 48 h. For A and B, left, representative images of western blots; right, quantification of western blot band density. p-AKT expression was normalized to both AKT and β-actin, and the quantification of p-AKT/AKT is shown. (C) Representative images of β-gal staining of P20 HCAECs. HCAECs were treated with H2O2 (100 μmol/l) for 4 h, followed by treatment with IGFBP1 (50 ng/ml), or IGFBP1 (50 ng/ml) plus LY294002 (10 μmol/l) for 48 h. One of two independent experiments is shown. Scale bar, 50 μm. (D) Quantification of β-gal-positive cells in P20 HCAECs treated with IGFBP1 (50 ng/ml), or IGFBP1 (50 ng/ml) plus LY294002 (10 μmol/l) for 48 h. (E) Quantification of β-gal-positive cells in P20 HCAECs treated with H2O2 (100 μmol/l) for 4 h, followed by treatment with IGFBP1 (50 ng/ml), or IGFBP1 (50 ng/ml) plus LY294002 (10 μmol/l) for 48 h. (F) Quantification of proliferation of P20 HCAECs treated with IGFBP1 (50 ng/ml), or IGFBP1 (50 ng/ml) plus LY294002 (10 μmol/l) for 48 h by a CCK-8 assay. (G) Quantification of proliferation by 3H-TdR incorporation by P20 HCAECs treated with IGFBP1 (50 ng/ml), or IGFBP1 (50 ng/ml) plus LY294002 (10 μmol/l) for 48 h. For A, B, D, E, F and G, one of two independent experiments, each with three biological replicates, is shown. Data are presented as the mean ± standard deviation. *P<0.05, **P<0.01. AKT, protein kinase B; IGFBP1, insulin-like growth factor-binding protein 1; CCK-8, Cell Counting Kit-8; HCAECs, human coronary arterial endothelial cells; OD, optical density; p, phosphorylated; P5, passage 5; P20, passage 20; 3H-TdR, tritiated thymidine; SA-β-gal, senescence-associated β-gal.


