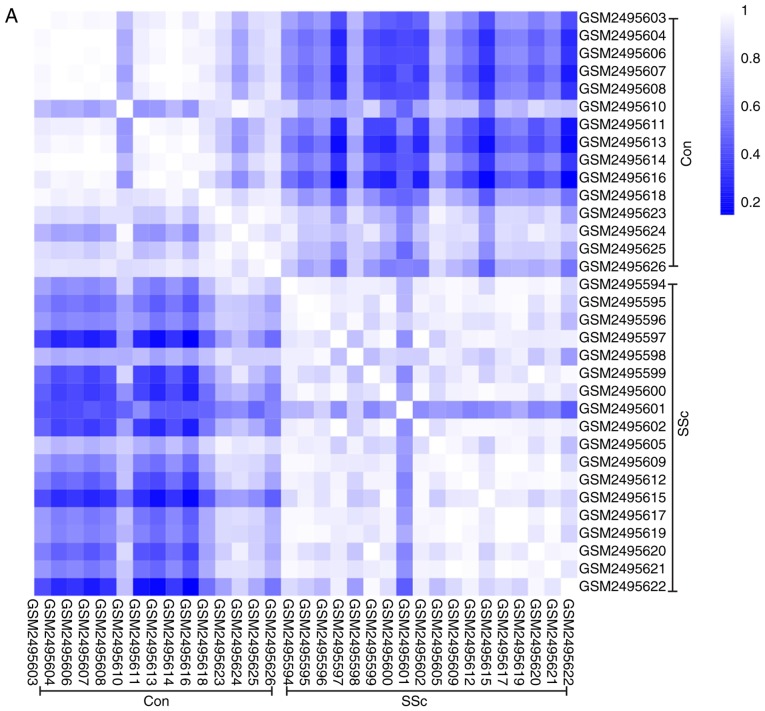
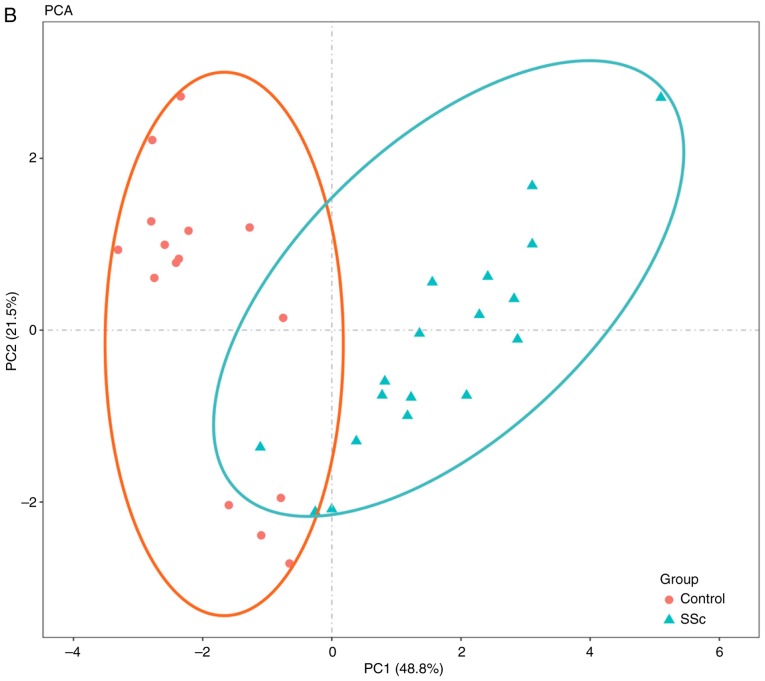
Figure 1.
Intra-group data repeatability test for GSE95065 through the Pearson's correlation analysis and PCA. (A) Pearson's correlation analysis of samples from the GSE95065 dataset. The color reflects the intensity of the correlation. When 0< correlation <1, there exists a positive correlation. When -1< correlation <0, there exists a negative correlation. The larger the absolute value of a number the stronger the correlation. (B) PCA of samples from the GSE95065 dataset. In the figure, PC1 and PC2 are used as the X-axis and Y-axis, respectively, to draw the scatter diagram, where each point represents a sample. In such a PCA diagram, the farther the two samples are from each other, the greater the difference is between the two samples in gene expression patterns. PC1, principal component 1; PC2, principal component 2; PCA, principal component analysis; SSc, Systemic sclerosis; Con, control.


