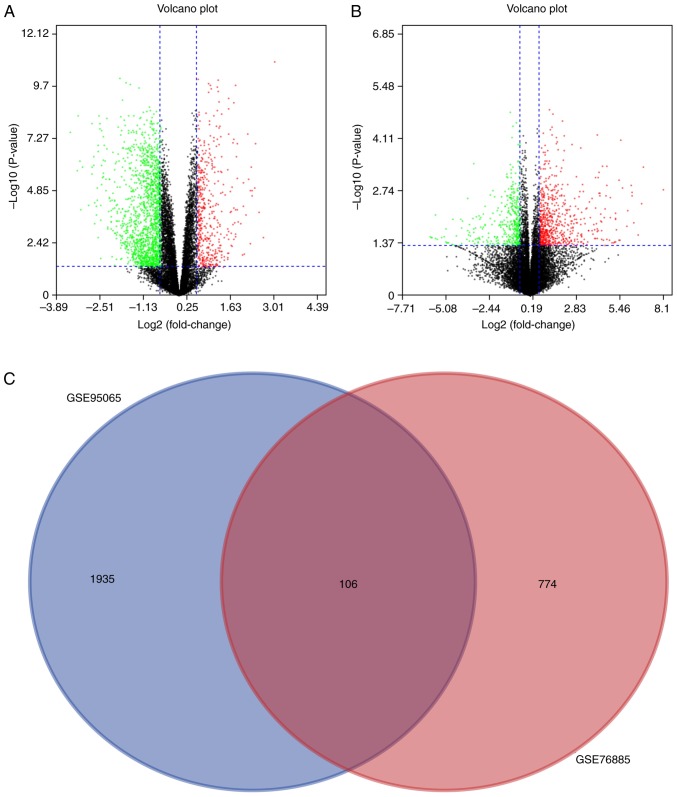
Figure 3.
Identification of DEGs between skin samples from healthy control individuals and patients with SSc. (A) A volcano plot showing the difference between SSc and control skin samples after analysis of the GSE95065 dataset with GEO2R. The X-axis represents the fold-change (log-scaled) and the Y-axis represents the P-value (log-scaled). Each symbol represents a different gene. The red symbols represent upregulated genes; green symbols represent downregulated genes. (B) A volcano plot of the GSE76885 dataset. (C) A Venn diagram showing that 106 genes are shared by both the GSE95065 and the GSE76885 datasets. SSc, systemic sclerosis; DEG, differentially expressed genes.

