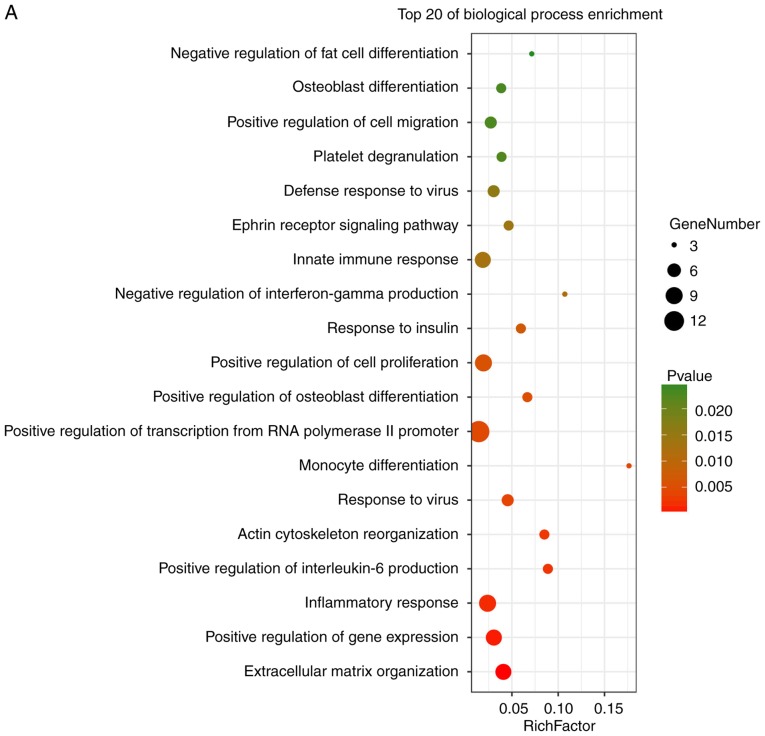
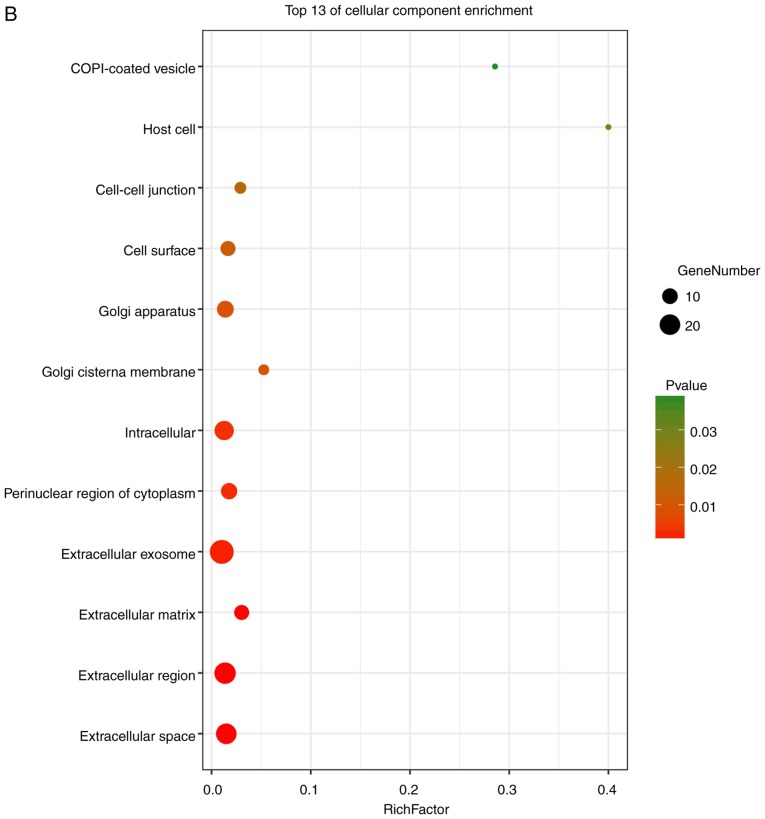
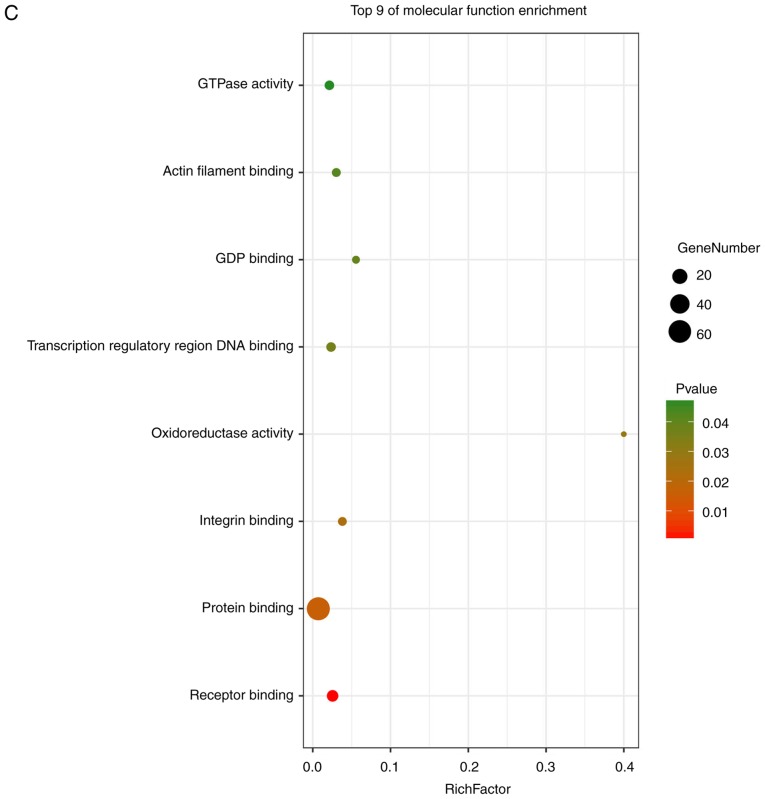
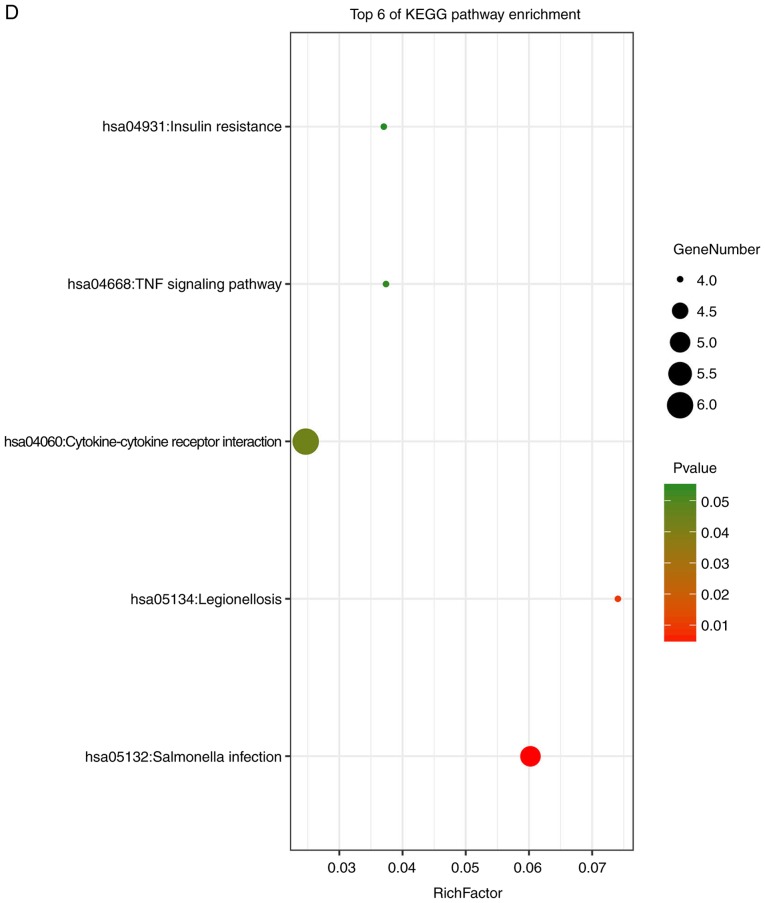
Figure 4.
Enrichment analysis of the DEGs using the DAVID tool. Detailed information relating to changes in the (A) biological processes, (B) cellular components in SSc and control skin samples. Enrichment analysis of the DEGs using the DAVID tool. Detailed information relating to changes in the (C) molecular functions of DEGs in SSc and control skin samples. (D) KEGG pathway analysis for DEGs. SSc, systemic sclerosis; DEGs, differentially expressed genes; KEGG, Kyoto Encyclopedia of Genes and Genomes.


