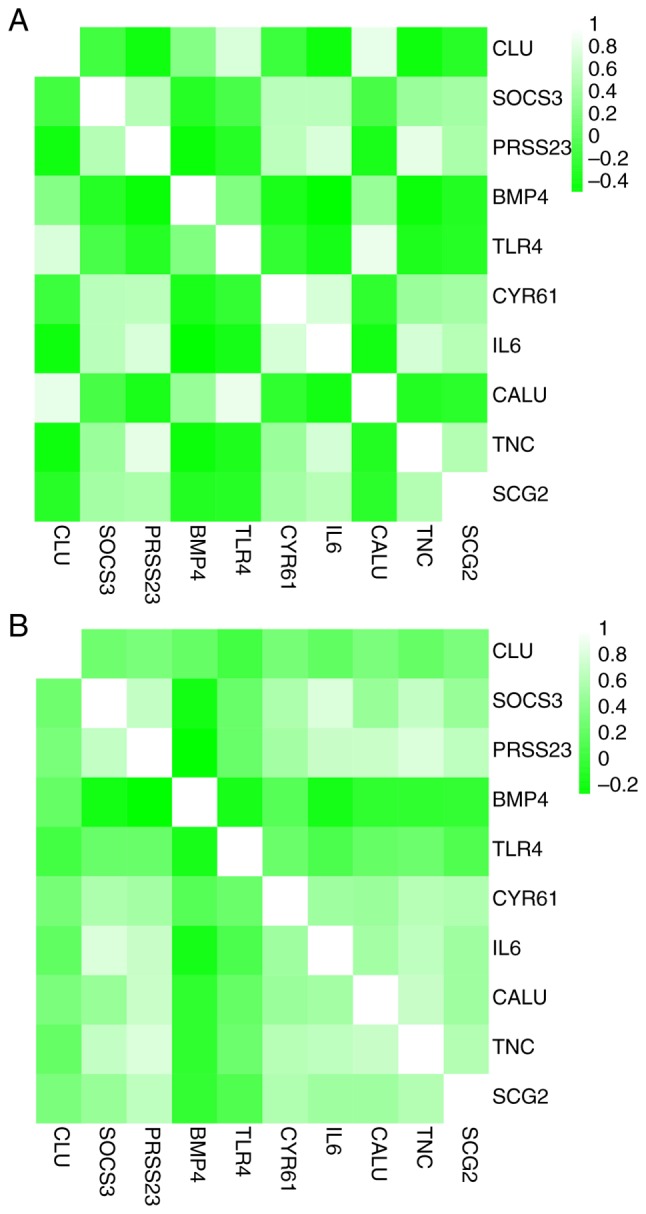
Figure 7.

Correlation analysis among the hub genes. Heat maps showing the correlations between hub genes in the (A) GSE95065 and (B) GSE76885 datasets. The color reflects the intensity of the correlation. When 0< correlation <1, there exists a positive correlation. When -1< correlation <0, there exists a negative correlation. The larger the absolute value of a number the stronger the correlation. IL6, interleukin-6; BMP4, bone morphogenetic protein 4; CALU, calumenin; CLU, clusterin; CYR61, cysteine rich angio-genic inducer 61; PRSS23, serine protease 23; SCG2, secretogranin II; SOCS3, suppressor of cytokine signaling 3; TLR4, Toll-like receptor 4; TNC, tenascin C.
