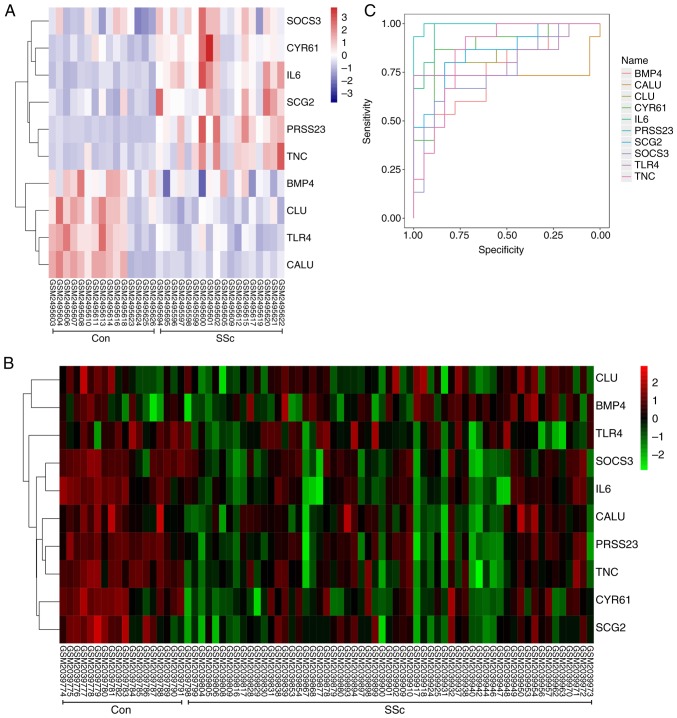
Figure 8.
Expression analysis and ROC curves of all the hub genes. (A) A hierarchical clustering heat-map of the hub genes from control and SSc skin tissue from the GSE95065 dataset. The X-axis represents sample symbols (from left to right: Samples of the control skin tissue and samples of SSc skin tissue); the Y-axis represents differentially expressed genes. Blue, low expression; white, medium expression; and red, high expression. (B) A hierarchical clustering heat-map of the hub genes from control and SSc skin tissue from the GSE76885 dataset. The X-axis represents sample symbols (from left to right: Samples of the control skin tissue and samples of SSc skin tissue); the Y-axis represents differentially expressed genes. Green, low expression; black, medium expression; and red, high expression. (C) ROC curves indicating that all hub genes could sensitively and specifically predict SSc. ROC, receiver operator characteristic; SSc, systemic scelerosis. IL6, interleukin-6; BMP4, bone morphogenetic protein 4; CALU, calumenin; CLU, clusterin; CYR61, cysteine rich angiogenic inducer 61; PRSS23, serine protease 23; SCG2, secretogranin II; SOCS3, suppressor of cytokine signaling 3; TLR4, Toll-like receptor 4; TNC, tenascin C.

