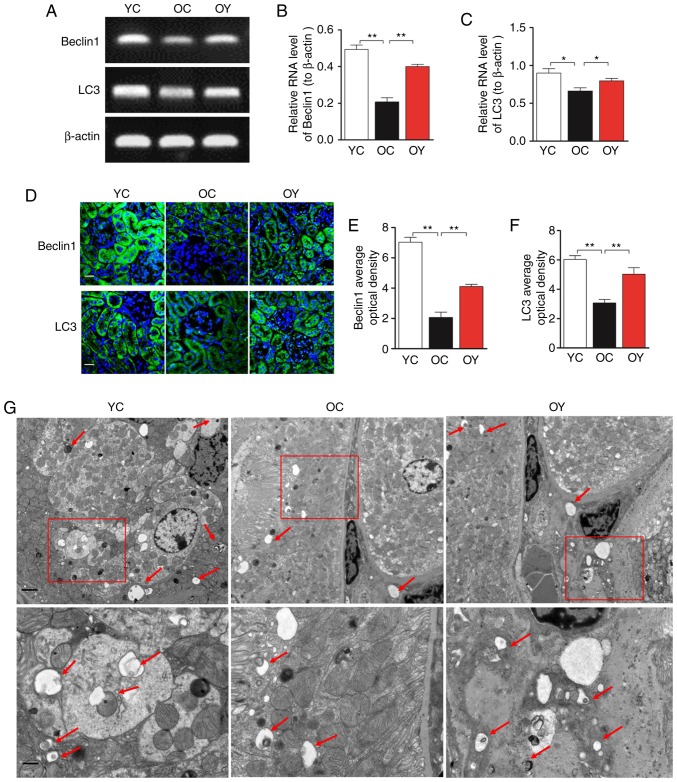
Figure 6.
Effects of incremental load training on autophagic markers Beclin 1 and LC3 in the kidney tissues of aged mice. (A) Comparison of the effect of incremental load training on the relative mRNA expression of Beclin 1 and LC3 in kidney tissues. Bar graphs show the relative quantification of (B) Beclin 1 and (C) LC3 mRNA. (D) Expression of Beclin 1 and LC3 was assessed by immunofluorescence staining (magnification, ×200; scale bar=20 μm). The green color indicates the positive signal; cell nuclei were counterstained with DAPI (blue). Bar graphs show the relative OD values of (E) Beclin1 and (F) LC3 staining. Values are expressed as the mean ± standard deviation (n=3). *P<0.05, **P<0.01. (G) Assessment of autophagic activity by transmission electron microscopy (magnification, ×6,000 and ×15,000; scale bars, 2 and 1 μm). The arrows indicate autophagic vacuoles. YC, young control group; OC, elderly control group; OY, elderly exercise group; OD, optical density; LC3, light chain 3.

