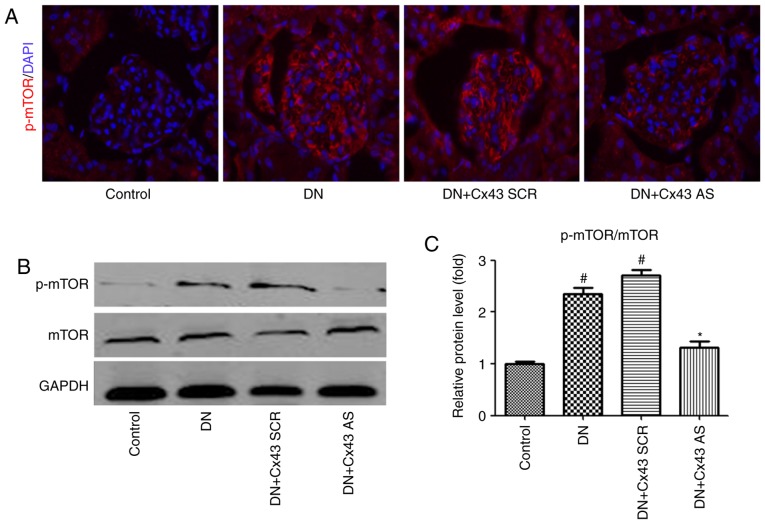
Figure 5.
Cx43 negatively regulated autophagic flux by enhancing mTOR signaling in the glomeruli of a DN rat model. (A) Immunofluorescence results (magnification, x400) indicating the expression of p-mTOR in each group. Blue, nuclear staining (DAPI); green, p-mTOR staining. (B) Western blot analysis of p-mTOR and mTOR. (C) Relative protein level of p-mTOR/mTOR in the control, DN, DN + Cx43 SCR, DN + Cx43 AS groups. The data are presented as the mean ± standard error of the mean, n=3 per group; #P<0.05 vs. control group; *P<0.05 vs. DN group (Bonferroni's correction). DN, diabetic nephropathy; mTOR, mammalian target of rapamycin.

