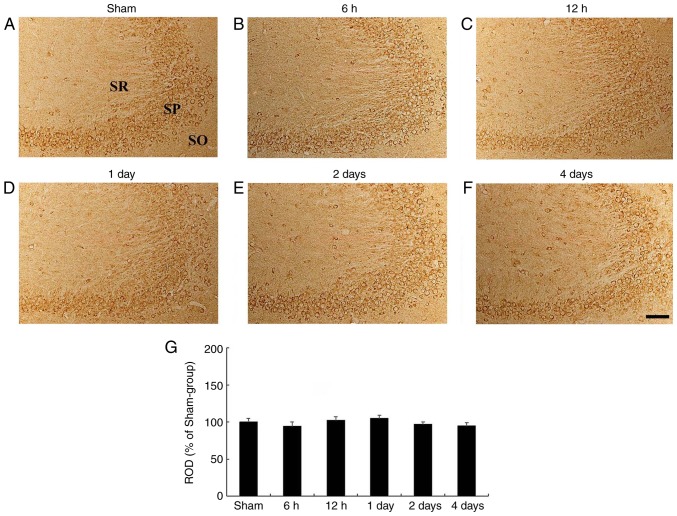
Figure 4.
HCN1 immunohistochemistry in the hippocampal CA3 region. (A-F) HCN1 immunohistochemistry in the CA3 subfield of the (A) sham- and ischemia-operated (B-F) groups at (B) 6 h, (C) 12 h, (D) 1 day, (E) 2 days and (F) 4 days. HCN1 immunoreactivity in the CA3 subfield was not signifi-cantly changed in any of the experimental groups. Scale bar, 50 µm. (G) ROD is presented as percentages of HCN1 immunoreactive structures in the CA3 subfield following tgCI (n=7 at each point in time). HCN1, hyperpolarization-activated cyclic nucleotide-gated 1; CA3, Cornu Ammonis 3; SO, stratum oriens; SP, stratum pyramidale; SR, stratum radiatum; ROD, relative optical density; tgCI, transient global cerebral ischemia.

