Abstract
Carbon nanomaterials are used to improve electrodes for neurotransmitter detection, but what properties are important for maximizing those effects? In this work, we compare a newer form of graphene, carbon nanospikes (CNSs), with carbon nanotubes (CNTs) grown on wires and carbon fibers (CFs). CNS electrodes have a short, dense, defect-filled surface that produces remarkable electrochemical properties, much better than CNTs or CFs. The CNS surface roughness is 5.5 times greater than glassy carbon, while CNTs enhance roughness only 1.8-fold. D/G ratios are higher for CNS electrodes than CNT electrodes, an indication of more defect sites. For cyclic voltammetry of dopamine and ferricyanide, CNSs have both higher currents and smaller ΔEp values than CNTs and CFs. CNS electrodes also have a very low resistance to charge transfer. With fast-scan cyclic voltammetry (FSCV), CNS electrodes have enhanced current density for dopamine and cationic neurotransmitters due to increased adsorption to edge plane sites. This study establishes that not all carbon nanomaterials are equally advantageous for dopamine electrochemistry, but that short, dense nanomaterials that add defect sites provide improved current and electron transfer. CNSs are simple to mass fabricate on a variety of substrates and thus could be a favorable material for neurotransmitter sensing.
1. Introduction
Carbon fibers (CFs) are the traditional material for electrochemical detection of neurotransmitters,1–3 but recent studies find that increasing their surface roughness with carbon nanomaterials will provide more surface area for electron transfer.4,5 Carbon nanomaterials have been used for electrochemical sensors because of their high surface-to-volume ratio, high electrical conductivity, chemical stability, and biocompatibility.4–6 Defect sites of the material are also important for promoting adsorption of neurotransmitters such as dopamine,7 although their action in enhancing electron transfer has been debated.4,8 Most carbon nanomaterials are forms of graphene, but they can have different structures and different amounts of sp2 and sp3 hybridization. Thus, many carbon nanomaterials have been developed, but there are still many open questions about how the structure or properties of the carbon nanomaterial influence the electrochemistry. In particular, comparisons of different structures and electrochemical properties are needed in order to understand and predict structure-function relationships.
Carbon nanospikes (CNSs) have recently been proposed as a novel carbon nanomaterial with good electrochemical properties.9–11 They are a form of graphene about 50 nm in length with tapered, spike-like features.9 CNS electrochemical properties are intriguing, as they can be used to detect neurotransmitters,12,13 catalyze CO2 reduction to ethanol,9,14 and as high-resolution AFM tips.15 Because of their short and dense surface structure, CNSs exhibit high surface-to-volume ratio to increase the surface area of electrodes. Also, their snowflake-like structure results in many edge-plane carbon sites exposed on the surface, which improves electron transfer and adsorption kinetics.9,13 CNSs are grown using plasma-enhanced chemical vapor deposition (PE-CVD) and thus can be grown on many wires simultaneously without the need to deposit a catalyst.16 Therefore, the fabrication process is simple, amenable to batch fabrication, and produces a uniform coating of the CNSs layer.13,17 CNSs are a promising material from a fabrication and electrochemical perspective, but their electrochemical properties have not systematically been compared with other carbon nanomaterials.
Carbon nanotubes (CNTs) were one of the first carbon nanomaterials used for electrochemistry. CNTs are comprised of sp2 basal-plane carbon hexagonal units in a highly-ordered tubular structure.18 When CNTs are coated or grown on electrodes, they increase the surface area and have electrocatalytic effects.19,20 For example, CNTs decrease the ΔEp and increase the current for dopamine detection.21–26 CNTs can be made into electrodes in a variety of different formats, from putting them into a carbon paste,20 to growing them on the surface of an electrode,27,28 to making a fiber or yarn out of the material and then using that as an electrode.24,26,29,30 Growth of CNTs requires a metal catalyst and that catalyst may be responsible for some of the improvements in electrochemical performance.19 While CNTs are more difficult to grow than CNSs, they are the standard carbon nanomaterials that are used to judge the performance of other carbon nanomaterials.
In this paper, we compared the electrochemical properties of CNSs grown on metal wires, CNTs grown on metal wires, and carbon fibers. This is the first time the electrochemistry of CNSs is systematically studied and compared with CNTs and CFs. Cyclic voltammetry (CV), chronoamperometry, electrochemical impedance spectroscopy (EIS), and fast-scan cyclic voltammetry (FSCV)31 were used to characterize the electrodes. By systemically studying all three electrode materials under similar conditions, we found that CNSs have much better electrochemical properties than CNT or CF electrodes for neurotransmitters. CNS microelectrodes have a greater surface roughness and numerous defect sites that improve current density, electron transfer kinetics, and adsorption. CNSs are a promising strategy for mass-fabricating microelectrode sensors or modifying any existing surface. This research also shows that short, dense and defect-rich nanomaterials are preferred for neurotransmitter detection and that new nanomaterial-modified electrodes should be designed with those properties in mind.
2. Materials and methods
2.1. Fabrication of CNT Microelectrodes
Niobium wires (diameter 25 μm, ESPI Metals, Ashland, OR) were used as electrode substrates. CNTs were grown using CVD following the protocols published before.27 A 30 nm layer of Al2O3 was deposited onto the niobium wire surface, followed by a 1 nm layer of Fe catalyst by electron beam physical vapor deposition (Angstrom Engineering, Canada). The coated niobium wires were aligned in a quartz tube chemical vapor deposition (CVD) reactor and degassed in vacuum. In a gas flow of Argon 2000 sccm (standard cubic centimeters per minute flow rate) and H2 200 sccm, the temperature was slowly ramped up to 700 °C and was held for 10 min. Then 10 sccm ethylene was introduced through the quartz tube for 5 min to grow the CNTs. The CNT-coated niobium wires were carefully inserted into a glass capillary, and sealed with 5-minute epoxy (J-B weld, Sulphur Springs, TX).
2.2. Fabrication of CNS Microelectrodes
The process of CNSs growth was modified from previous research.13 Niobium wires (diameter 25 μm, ESPI Metals, Ashland, OR) were fixed to a stainless-steel stage, and placed into a custom-built DC plasma-enhanced chemical vapor deposition (PECVD) chamber. During the CNS growth, the metal wires served as the cathode for the DC plasma. The pressure of the chamber was 6 Torr and the wires were exposed to 100 sccm ammonia and 80 sccm acetylene for 6 minutes. The DC plasma discharge was operated at 250 mA and 480–550 V at 650 °C. The CNS coated niobium wires were inserted into a glass capillary, and sealed with 5-minute epoxy (J-B weld, Sulphur Springs, TX).
2.3. Fabrication of CF microelectrodes
Carbon fibers with a diameter of 30 μm (World Precision Instruments, Sarasota, FL) and 7 μm (T650–35, Cytec, Woodland Park, NJ) were directly inserted into a glass capillary and sealed with 5-minute epoxy (J-B weld, Sulphur Springs, TX).
2.4. Measurements and sample characterization
Scanning electron microscope (SEM) images were taken on Merlin field emission SEM (Zeiss, Thornwood, NY) and FEI Quanta 650 SEM (Thermo Fisher Scientific, Waltham, MA). Secondary electron detector was used at an accelerating voltage of 3.0 kV.
Surface roughness was measured using Wyko NT9800 Optical Profilometer (Bruker Corporation, Billerica, MA). Vertical shift interferometry (VSI) mode was used to measure the surface profile along the cylinder axis of the electrodes. A 50× optical lens was used and the sampling size was 96 nm. Cylinder tilt correction was applied.
Raman spectroscopy measurements were performed using Renishaw 100 confocal microRaman system (Renishaw, Hoffman Estates, IL) with 1800 lines/mm diffraction grating. A 532 nm laser was focused to a spot size of about 2 μm through a 100× objective, and a Peltier-cooled charge coupled device detector. Laser intensity was 50% and scan range was 100 cm−1 to 3200 cm−1.
Cyclic voltammetry, chronoamperometry and electrochemical impedance spectroscopy experiments were performed with Reference 600 potentiostat (Gamry Instruments, Warminster, PA). A three electrodes system was used where the working electrode was the CNS, CNT, or CF electrode, the reference electrode was a standard Ag/AgCl electrode, and the counter electrode was a Pt wire. For amperometry experiments, a potential of −0.6 V was applied for 10 seconds. For EIS experiments, the frequency range is 100 kHz to 0.1 Hz, and the amplitude of the AC voltage applied was 10 mV.
FSCV experiments were performed with a ChemClamp potentiostat and head-stage (Dagan, Minneapolis, MN). A two-electrode system was used, with a working electrode versus Ag/AgCl reference electrode. Four M KCl solution was filled into the glass capillary of each electrode, and a metal wire inserted, to make an electrical connection. The buffer and neurotransmitter solutions were injected through a flow cell at 2 mL/min by a syringe pump (Harvard Apparatus, Holliston, MA) and modulated by a six-port loop injector with an air actuator (VIVI Valco Instruments, Houston, TX). The electrochemical data were collected and analyzed with HDCV Analysis software (Department of Chemistry, University of North Carolina at Chapel Hill).
3. Results and discussion
3.1. Surface area studies
3.1.1. Scanning electron microscopy (SEM)
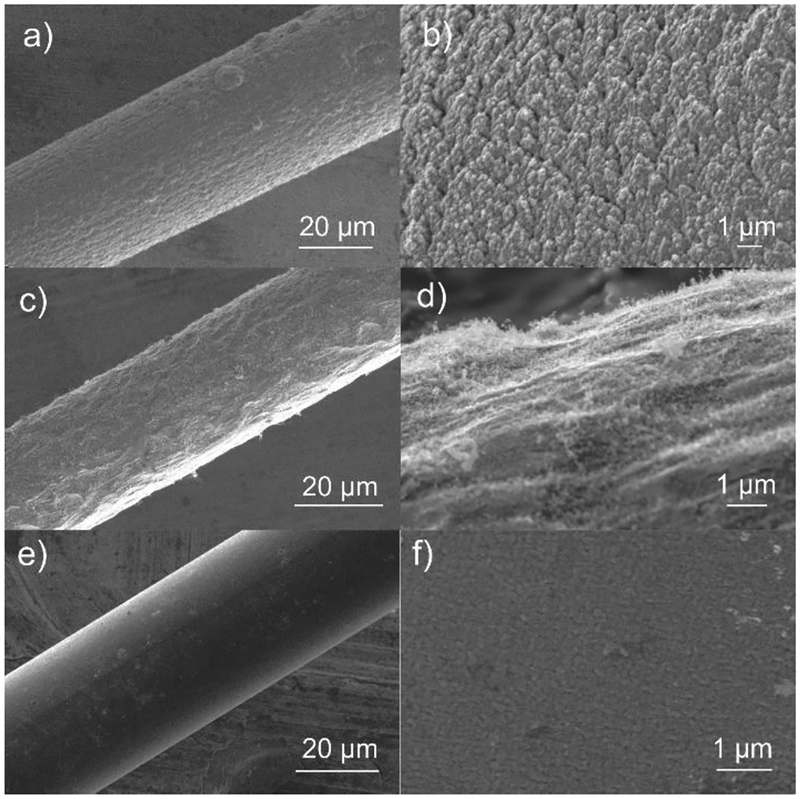
To compare electrodes of approximately equal diameter, CNSs and CNTs were grown on Nb wires with 25 μm diameter and carbon fibers were used that were advertised to be 30 μm diameter. Using SEM, the measured diameters of cylindrical CNS, CNT and CF microelectrodes are 33 μm, 29 μm, and 34 μm respectively (Figure 1). Figure 1a and 1b show CNS morphology and the CNSs are short, dense, and aligned vertically to the electrode surface. Figure 1c and 1d show that CNTs grown on niobium are short and wispy, less dense than CNSs, and while they are mostly vertical, they are not fully aligned. CNTs cover most of the niobium wire. However, catalyst deposition is directional so the underside of the wire might not be completely covered. Figures 1e and 1f indicate that CF has smooth carbon surface without much nanostructure. Thus, the SEMs demonstrate differences in nanostructure and surface roughness that might influence electrochemical properties.
Figure 1.
SEM images of a-b) CNS, c-d) CNT and e-f) CF microelectrodes. a), c) and e) Zoomed out CNS, CNT and CF cylindrical microelectrodes to see the coating efficiency; b), d) and f), Higher zoom images to understand the morphology of the CNS, CNT and CF electrode surface.
3.1.2. Surface roughness
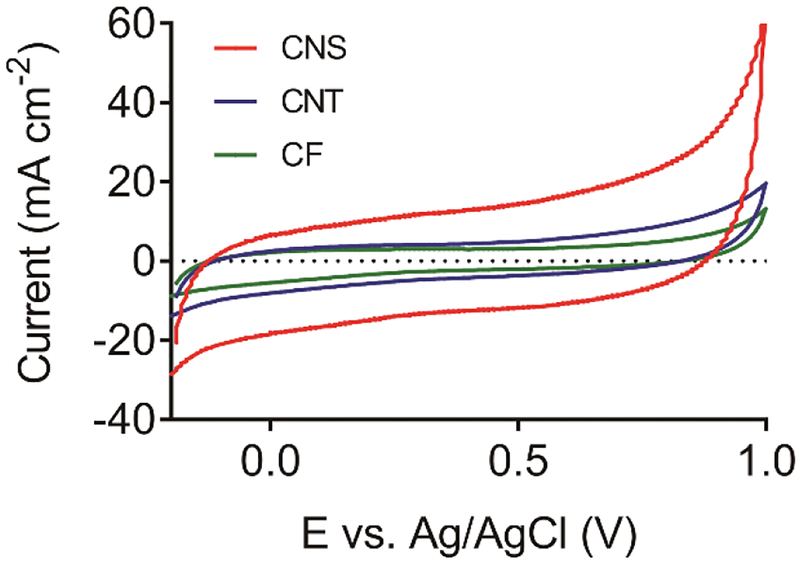
The geometric area of an electrode can be estimated by measuring the radius and length under a microscope and calculating the surface area of a cylinder (2πrl). Optical profilometer was used to measure the physical surface roughness of CNS, CNT and CF electrodes (Figure S1). The average roughness (Ra) of a CF is smaller than 10 nm, indicating a very smooth surface. The Ra value of CNS (0.13 ± 0.02 μm) is smaller than CNT (0.27 ± 0.05 μm), which proves the CNSs are short and dense, and relatively shorter than CNTs. However, the surface roughness measured by optical microscope does not take into account nanostructuring. To quantify the surface roughness including nanostructuring, we used cyclic voltammetry to measure double layer capacitance and then compared this number to glassy carbon to get a surface roughness enhancement.32 The background current for CNS electrodes is much greater than that of CF or CNT electrodes (Figure 2). To estimate capacitance, the anodic and cathodic current response at 0.5 V was used (see supplemental theory section). As listed in Table 1, the capacitance of CF microelectrodes is 26 ± 7 μF∙cm−2, similar to the capacitance of mirror-like glassy carbon which is about 24 μF∙cm−2.33 The capacitance of CNT microelectrodes is 43 ± 17 μF∙cm−2, which is larger than CF microelectrodes. The capacitance for CNS microelectrodes was 132 ± 21 μF∙cm−2, which is about five-fold larger than CF microelectrodes.
Figure 2.
The background charging current CV for CNS, CNT and CF microelectrodes. Electrodes were scanned from −0.2 to 1.0 V at 100 mV/s scan rate in 0.1 M PBS pH 7.4 buffer.
Table 1:
Capacitance and surface area measurements of electrodes
| Capacitance (μF∙cm−2) | Surface roughness (x-fold over GCE) | Electroactive area (×10−3 cm2) | Calculated area (×10−3 cm2) | Electroactive area ratio | |
|---|---|---|---|---|---|
| CNS (n = 10) |
132 ± 21 | 5.5 ± 0.9 | 1.9 ± 0.2 | 2.1 | 0.92 ± 0.09 |
| CNT (n = 10) |
43 ± 17 | 1.8 ± 0.7 | 1.1 ± 0.4 | 1.8 | 0.65 ± 0.17 |
| CF (n = 10) |
26 ± 7 | 1.1 ± 0.3 | 1.7 ± 0.1 | 2.1 | 0.79 ± 0.03 |
Values are mean ± standard deviation.
If we take the measured capacitance values and divide them by the lower limit capacitance of glassy carbon (which is considered to be flat),33,34 we can estimate a surface roughness enhancement factor. The surface roughness factor was 5.5 ± 0.9 for CNS, 1.8 ± 0.7 for CNT, and 1.1 ± 0.3 for CF microelectrodes (Table 1). These numbers reveal that the CF electrode surface is essentially flat, like glassy carbon. CNTs have a smaller capacitance than CNSs, likely because they are not as dense on the metal wire (Figure 1) or the metal wires are not fully covered. Also, CNTs mostly consist of basal-plane carbon, whose capacitance is smaller than the edge-plane sites.35 The CNS electrodes have a large capacitance and large surface roughness. This matches the SEM images in Figure 1B, which show a large amount of nanostructuring. Thus, the CNS electrodes have a much rougher surface than grown CNT or CF microelectrodes.
3.1.3. Electroactive surface area
The background current of CV measures the amount of material on the electrode that charges, but not all carbon that contributes to the background may be available as electroactive sites. For example, if a thick nanomaterial layer is applied to an electrode, it will have a large charging current but the analyte will not be able to access the whole layer, so it will not be all electroactive. We used chronoamperometry to measure the electroactive surface area (see supplemental theory section).32 By comparing the electroactive area with the calculated geometric area, which is the surface area measured under a microscope, we can estimate how much surface area of the electrodes is electrochemically active. Ru(NH3)63+/2+ is the optimal choice for measuring the electroactive area, because it is a near-ideal outer-sphere electron transfer redox probe.36 The thickness of the diffusion layer is about 30 μm at 1 s,32 much larger than the nanometer scale of the surface roughness, so surface roughness is not considered in this experiment.
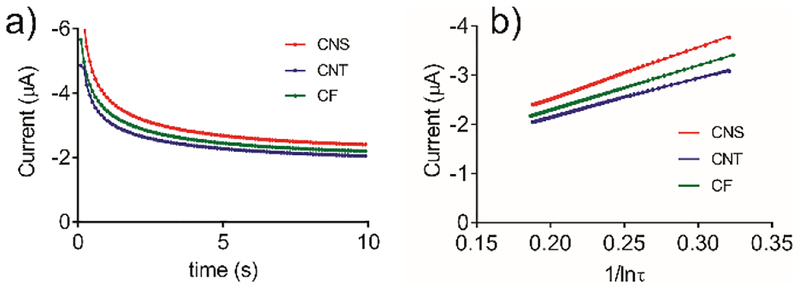
Figure 3a plots the current responses of CNS, CNT, and CF electrodes for 10 s in 5 mM Ru(NH3)63+ when −0.6 V was applied. The time period after 1.2 s was identified as the long-time limit, and using that data, current versus 1/ln τ is linear (Figure 3b). The electrochemical area can be calculated from the slope, which is proportional to A/r. Since all of the radii are similar, the graph in Figure 3b indicates that CNS electrodes have a greater electroactive area than CNT or CF electrodes, which have lower slopes. Table 1 lists the electroactive surface area measured by chronoamperometry, the calculated surface area using under a microscope, and the ratio of them. CNS microelectrodes have the largest active surface area ratio at 0.92 ± 0.09 (n = 10), indicating the best overall activity to outer-sphere Ru(NH3)63+/2+. The active surface area ratio of CNT microelectrodes (0.65 ± 0.17, n = 10) and CF microelectrodes (0.79 ± 0.03, n = 10) are significantly smaller than CNS microelectrodes (one-way ANOVA, Bonferroni post-test p < 0.001 for both).
Figure 3.
a) Chronoamperometry current response with time, b) linear fitting of current vs. .
These studies show that CNS electrodes have a higher proportion of active surface area than CNT and CF electrodes. Thus, the CNS nanostructuring is adding significant electroactive sites and not just adding a thick layer that is inaccessible to the analyte. The increase in electroactive sites might be due to more nanomaterial be deposited. Another factor is the structure of the carbon surface, because the electron transfer rate is two orders of magnitude faster at the edge plane than the basal plane.37 A larger portion of edge-plane sites of CNSs may contribute to the greater electrochemical active area, since edge-plane carbon sites are much more reactive than basal-plane sites. Thus, the next experiments examined the surface structure.
3.2. Surface structure studies
3.2.1. Raman spectroscopy
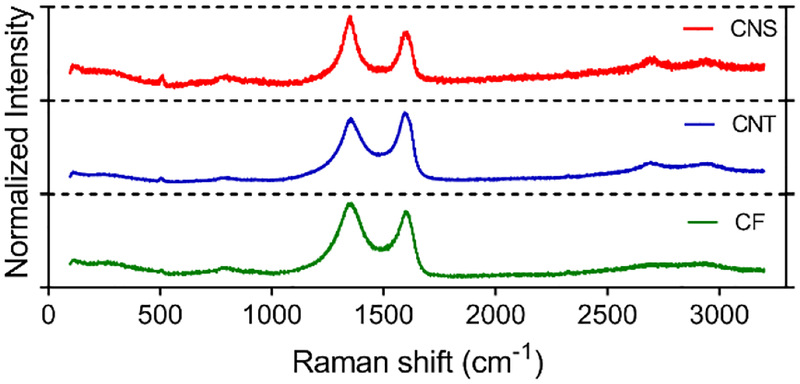
Raman spectra were collected to understand the structures of the carbon in CNS, CNT, and CF electrodes (Figure 4). The Raman spectra contain both peaks typical of carbon: a D band (~1360 cm−1) due to defects from boundaries, like edge plane sites or doping, and a G band (~1580 cm−1), indicating sp2 graphitic carbons.38,39 The D/G ratio, which is the ratio of the area under the two peaks, is calculated to evaluate the disorder level of the carbon materials. The D/G ratio is the largest at 2.2 for CNSs, indicating CNSs are rich in defects, which are favorable for faster electron transfer kinetics and can promote adsorption of molecules in FSCV.33,40 CNTs exhibit the smallest D peak and the D/G ratio is 1.5, due to the predominance of sp2-bonded carbon atoms in CNTs. The D peak of CNTs is observed because of edge plane sites at the end-cap and along the tube axis.7,27 CFs have a D/G ratio around 2.0, indicating a defect-rich surface but not as many defects as CNSs. The higher D/G ratio of CNSs may be due to more broken carbon bonds and defects in the small tapers of the CNSs.41
Figure 4.
Raman spectra of CNSs, CNTs and CF. The peak at 1360 cm−1 is the D peak and at 1580 cm−1 is the G peak.
3.2.2. Surface structure and electrochemistry
To understand how surface structure affects electrochemistry, we performed cyclic voltammetry on CNS, CNT and CF electrodes. Three redox couples with different surface sensitivity were used to investigate the electron transfer kinetics, Ru(NH3)63+/2+, an outer-sphere redox couple insensitive to the surface,42 Fe(CN)63-/4-, a standard inner-sphere redox couple sensitive to carbon surface,42,43 and dopamine, a surface sensitive redox couple, which adsorbs onto the carbon surface. Dopamine adsorption is influenced by surface graphitic types, functional groups, and electrostatic interactions.8,44
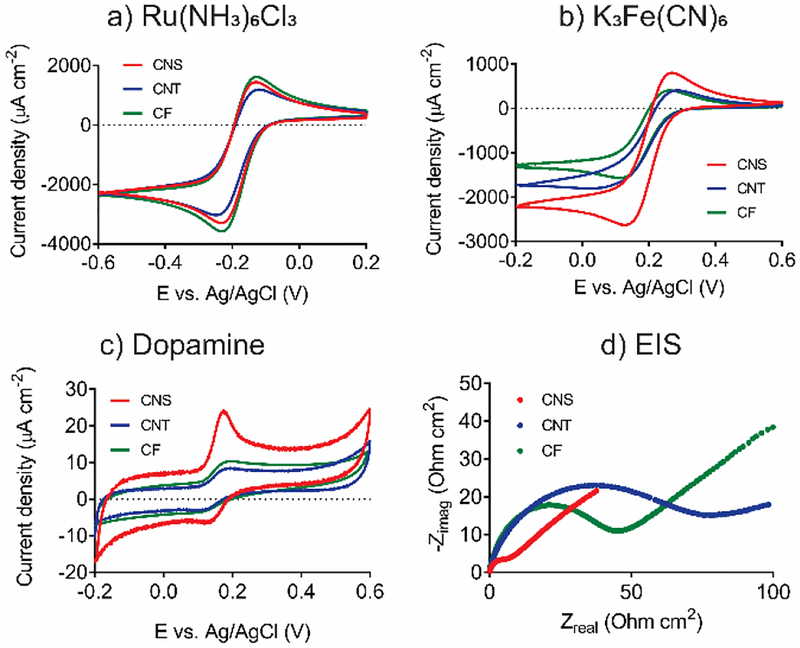
In Figure 5a, the cyclic voltammograms of Ru(NH3)63+/2+ are similar for CNS, CNT, and CF microelectrodes. Cyclic voltammograms of CNT microelectrodes show slightly smaller current density, which may be due to metal wires that are not entirely covered with CNTs. However, with an outer sphere, surface-insensitive probe, the response of all three electrodes is largely the same. On the other hand, with surface sensitive probes, there is more of a difference in the CVs between the different electrodes. CNS microelectrodes are the most sensitive to inner-sphere Fe(CN)63-/4- since they exhibit the largest oxidation and reduction current density (Figure 5b). Similarly, for dopamine (Figure 5c), the peaks are larger and more pronounced at CNS microelectrodes compared with CNT and CF microelectrodes. The enhanced currents at CNS microelectrodes are attributed to the large surface area and more edge plane sites for adsorption. The CVs in Figure 5 were normalized by geometric area and thus the larger and more pronounced peaks are due to greater electroactivity at CNS electrodes, not greater surface area.
Figure 5.
Electrochemical characterization of CNS, CNT and CF electrodes. Currents are normalized by geometric area. a) CV of 10 mM Ru(NH3)63+/2+; b) CV of 10 mM Fe(CN)63-/4-; c) CV of 20 μM dopamine; and d) EIS Nyquist plot obtained in 10 mM Fe(CN)63-/4-.
Peak-to-peak separation (ΔEp) in cyclic voltammetry is an indication of electron transfer kinetics. All the electrodes exhibit ΔEp larger than ideal values, which indicates a quasi-reversible behavior. For outer-sphere Ru(NH3)63+/2+, there is an overall effect of type of microelectrode on ΔEp (One-way ANOVA, Bonferroni post-test p < 0.001). The ΔEp for Ru(NH3)63+/2+ of CNS microelectrodes (103 ± 5 mV, n = 10) is significantly smaller than CNT microelectrodes (146 ± 33 mV, n = 8, Bonferroni post-test p < 0.001) but not different than CF microelectrodes (109 ± 8 mV, n = 8). CNSs provides more edge-plane sites than CNTs, which are advantageous for electron transfer kinetics. This trend is more obvious for inner-sphere Fe(CN)63-/4-, where there is also an overall effect of electrode type (one-way ANOVA, n = 8, p < 0.001). The ΔEp for CNS microelectrodes (129 ± 15 mV, n = 10) is significantly smaller than both CNT (189 ± 22 mV, n = 8, Bonferroni post-test, p < 0.001) and CF microelectrodes (151 ± 13 mV, n = 8, Bonferroni post-test, p < 0.001). For dopamine, the ΔEp of CNS microelectrodes is 38 ± 3 mV (n = 4), which is significantly smaller than CNT (71 ± 10 mV, n = 4, Bonferroni post-test, p < 0.01) and CF microelectrodes (55 ± 7 mV, n = 4, Bonferroni post-test, p < 0.01). Thus, the CNS electrodes exhibit fast electron transfer, for both outer sphere and inner-sphere compounds. These results are in agreement with previous research, where edge-plane-rich glassy carbon exhibits faster electron transfer rates than highly oriented pyrolytic graphite, for both Ru(NH3)63+/2+ and Fe(CN)63-/4-.33 Since ohmic drop and peak current are also contributing factors to peak separation, the electron transfer kinetics were further examined by electrochemical impedance spectroscopy (EIS).
Figure 5d shows the Nyquist plot of EIS obtained in K3Fe(CN)6 solution (x-axis shifted to compensate for solution resistance). The CNS microelectrode has the smallest semicircle, which indicates the smallest electron transfer resistance (Rct). The equivalent circuit is used to fit the impedance plot can calculate each parameter (See supporting information). Rct was 4 ± 1 Ω∙cm2 for CNS, 22 ± 8 Ω∙cm2 for CNT, and 18 ± 3 Ω∙cm2 for CF electrodes (Table 2). There is an overall trend of Rct varying with type of carbon (one-way ANOVA, p < 0.001) and Bonferroni post-tests indicate Rct for CNS electrodes is less than that of CNT (p < 0.001) or CF (p < 0.001) electrodes. The CNS electrode has the lowest Rct and lowest ΔEp, while CNTs have a higher Rct and higher ΔEp. Thus, the CNS surface has better electrochemical reactivity.
Table 2:
Electron transfer data for CNS, CNT and CF microelectrodes.
| Ru(NH3)6Cl3 ΔEp (mV) | K3Fe(CN)6 ΔEp (mV) | Dopamine ΔEp (mV) | Rct (Ω∙cm2) | |
|---|---|---|---|---|
| CNS (n = 4–10) |
103 ± 5 | 129 ± 15 | 38 ± 3 | 4 ± 1 |
| CNT (n = 4–8) |
146 ± 33 | 189 ± 22* | 71 ± 10* | 22 ± 8* |
| CF (n = 4–8) |
109 ± 8 | 151 ± 13* | 55 ± 7* | 18 ± 3* |
The value is significantly different than that of CNS microelectrodes (p < 0.01).
3.3. FSCV detection of neurochemicals
3.3.1. FSCV detection of dopamine
FSCV is the predominant electrochemical technique used to make real-time measurements of neurotransmitter changes in the brain.2,45 Carbon fibers used for FSCV in tissue are typically 7–10 μm in diameter, but we used the 30 μm carbon fiber to keep the size consistent with CNS and CNT microelectrodes, and its performance is similar to traditional 7 μm CFs (Figure S3). While CNSs and CNTs have been explored for enhanced dopamine detection with FSCV,13,27,46 here, we directly compare the FSCV responses to understand which material is more advantageous for FSCV detection of neurotransmitters.
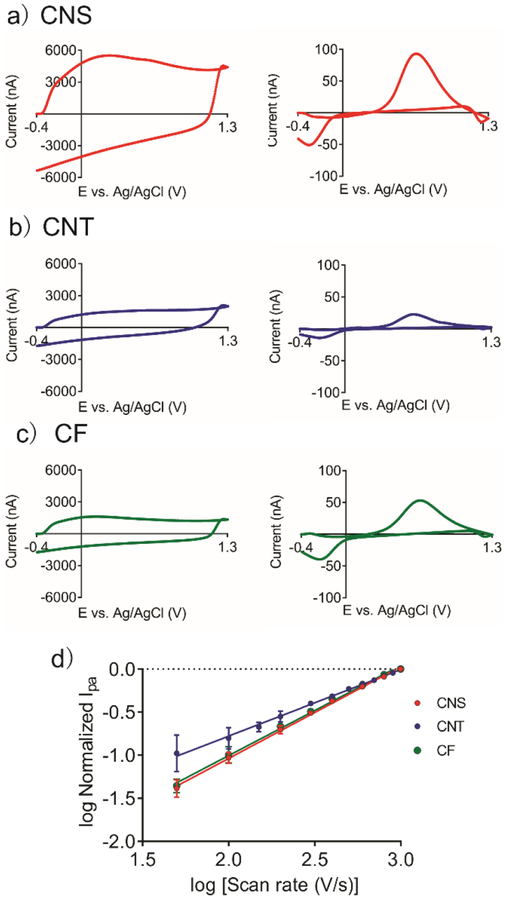
First, we compared the background charging currents (Figure 6). The magnitude of background current for CNS microelectrodes is much larger than CNTs and CFs, due to their large surface roughness. In the FSCV background, there is a peak at around 0.25 V for the CNS and CF but not for the CNT microelectrodes, which is due to surface oxides on graphitic defect sites.47 The surface oxides groups are advantageous for dopamine adsorption and thus increase the sensitivity for dopamine detection.48,49 Therefore, defect-rich CNS and CF electrodes exhibit the feature, while highly-ordered CNT electrodes do not.
Figure 6.
Fast-scan cyclic voltammetry background current (Left column) and background subtracted detection of 1 μM dopamine (Right column) for a) CNS microelectrodes; b) CNT microelectrodes; c) CF microelectrode. d) Scan rate study for all electrodes (n = 3).
Second, we compared the FSCV responses for dopamine. The shapes of CVs are similar and there is no significant difference in ΔEp (Bonferroni post-test, p < 0.001). At a scan rate of 400 V/s, ΔEp is 0.86 ± 0.09 V for CNS, 0.84 ± 0.06 V for CNT, and 0.84 ± 0.04 V for CF electrodes. In FSCV, the scan rate is comparable to electron transfer rate, therefore the ΔEp is large for all electrode materials and differences in ΔEp cannot be observed. The average anodic peak currents for CNS microelectrodes (92 ± 5 nA, n = 8) are larger than for CNTs (22 ± 6 nA, n = 12, one-way ANOVA Bonferroni post-test, p< 0.001) and CFs (49 ± 5 nA, n = 5, Bonferroni post-test, p< 0.001) microelectrodes, also due to more adsorption sites provided by the defect-rich carbon surface.
To further examine the adsorption of dopamine, we varied the scan rate and plotted the log peak current (i) vs. log scan rate (v) curve of the electrodes (Figure 6d). In a diffusion-controlled process, the peak current is linear to the square root of scan rate while in an adsorption-controlled process, the current is linear with the peak current. Thus, the slope of log i vs.log v curve indicates the extent to which the electrochemistry is governed by diffusion (expected slope 0.5) or adsorption (expected slope 1.0). The slope for CNS microelectrodes is 1.07, CF is 1.05, and CNT is 0.77, which indicates dopamine is an adsorption-controlled process at CNS or CF electrodes, and a mixture of diffusion and adsorption controlled at CNT electrodes. CNTs are composed of mostly basal-plane carbon, which lacks functional groups, therefore only the edge-planes at the end-caps and along the tube axis are adsorption sites. Although the basal planes in CNTs are not the most favorable sites for adsorption, dopamine can still diffuse to these sites and react. Thus, we observed a mixture of diffusion and adsorption kinetics at CNT electrodes.
3.3.2. FSCV detection of other neurochemicals
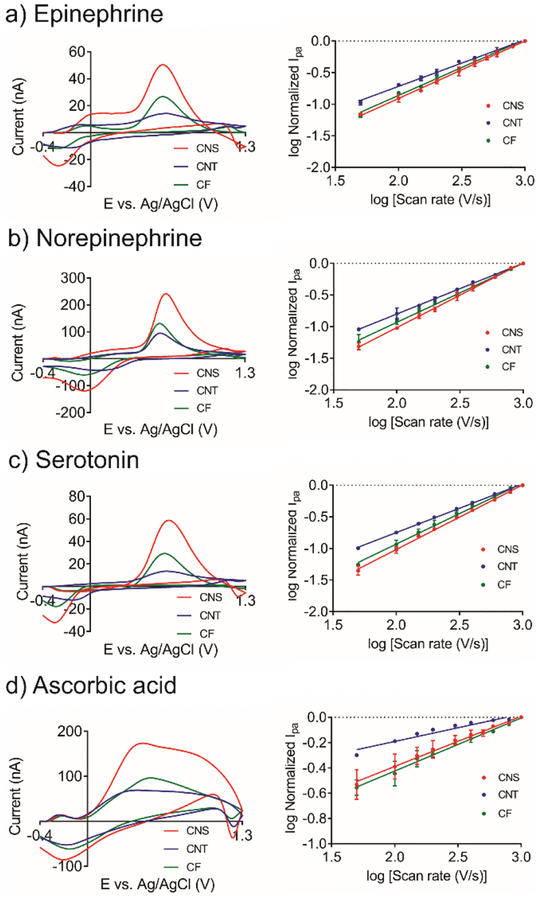
We also performed FSCV detection of other neurochemicals, including epinephrine, norepinephrine, serotonin, and ascorbic acid. The structures of the neurochemicals and their pKa values are shown in Table S1. Epinephrine, norepinephrine, and serotonin are positively charged at physiological pH of 7.4; therefore, they are able to pre-adsorb onto the negatively charged electrode surface. Figure 7 shows the CVs with the current response. Similar to dopamine, the peak potentials and the peak-to-peak separation are largely the same for all materials for these compounds, indicating no significant difference in electron transfer rate for all electrodes. CNS microelectrodes show the highest peak current for epinephrine, norepinephrine, and serotonin, because CNSs have more defect sites for adsorption of cations. The peak shapes for the cations are also quite different at CNT electrodes, with broader peaks than for CNS or CF electrodes, likely due to less adsorption. The anodic peak current ratio for each neurochemical to the dopamine current are shown in Figure S3. The ratio of ascorbic acid to dopamine is smaller for CNS than CNT electrodes, since the electrochemical reaction of ascorbic acid is controlled by diffusion, not adsorption. The ratio of serotonin to dopamine current is also smaller for CNS electrodes, which might due to serotonin fouling on the electrode surface, which could block some active sites. These results indicate that CNS electrodes would have greater selectivity for cations over anions than other carbon materials.
Figure 7.
Detection of other neurochemicals at CNS, CNT and CF microelectrodes. FSCV responses (Left column) and scan rate study (Right column, n = 3) of a) 1 μM epinephrine, b) 1 μM norepinephrine, c) 1 μM serotonin, d) 200 μM ascorbic acid in PBS buffer. For slopes of lines in log i vs log v plots, see Table S2.
Scan rate studies were performed for all of the analytes and results are shown in Figure 7a–c and Table S2. The slopes for the cationic norepinephrine, epinephrine, and serotonin are close to 1 for CNS and CF microelectrodes, which indicates adsorption-controlled processes. The slope for CNT electrodes is between 0.5 to 1 indicating a mixture of adsorption and diffusion occurred during the electrochemical reaction. Ascorbic acid is negatively charged at a pH of 7.4, and the electrostatic force prevents its pre-adsorption onto the negatively-charged electrode surface. Therefore, the slope for ascorbic acid is smaller than 0.5 because it would also be repelled from the surface (Figure 7d and Table S2). Overall, the results further proved the defect-rich carbon surface structure of CNS electrodes is advantageous for detection of a variety of cationic neurochemicals due to adsorption.
4. Discussion
CNSs are an ideal material for neurotransmitter electrochemistry because they have both large surface roughness and a high proportion of edge plane sites for adsorption. Table 3 summarizes both the surface properties of CNS, CNT and CF microelectrodes and the electrochemical properties that result from them. CNS electrodes have a very rough surface that results in a larger current density and enhanced sensitivity. CNTs grown on metal wires are not as rough and CFs are relatively smooth, so they have smaller current densities. All the electrodes were roughly the same size for geometric area, thus the CNS electrodes provide much more current for the same size of implanted sensor. CNTs electrodes are also more defect-rich than the highly-ordered CNTs, therefore, the percentage of area that is electrochemically active is higher for CNS electrodes. More defects also lead to both higher currents and smaller ΔEp values for inner-sphere compounds compared at CNS electrodes compared to CNTs and CFs. The CNS electrodes have a very low resistance to charge transfer. In FSCV detection of dopamine and other cationic neurotransmitters, adsorption-controlled kinetics are observed at CNS electrodes while CNT electrodes have a mixture of diffusion and adsorption-controlled kinetics. This study shows that CNS electrodes have a larger current for cationic neurotransmitters due to two effects: a larger surface area due to enhanced surface roughness and more active area due to enhanced adsorption to defect sites.
Table 3.
Comparison of the structures and electrochemical properties of CNS, CNT and CF.
| Surface morphology | CV dopamine | Surface defects | Electroactive surface area | Electron transfer | FSCV dopamine | FSCV kinetics | FSCV other neurochemical | |
|---|---|---|---|---|---|---|---|---|
| CNS | Dense spikes, very rough, 5.5-fold | High current density | Defect-rich | High active area | Fastest ET, lowest | Highest current density | Adsorption | Enhanced cationic over anionic analytes |
| CNT | Not as dense, longer CNTs, 1.8-fold | Lower current density | Lowest defects | Low active area | Lowest ET rate, Highest | Lowest current density | Mixture of adsorption and | No enhancement |
| CF | Smooth, 1.1-fold rougher than GC | Lower current density | Moderate defects | Moderate active area | Moderate ET, moderate | Moderate current density | Adsorption | Enhance cationic over anionic |
By correlating the surface properties of the carbon materials to their electrochemical properties, we can better understand and predict the behavior of the microelectrode sensors. Increasing the surface area, by materials such as CNTs is beneficial, but not as beneficial as increasing the area with carbon nanomaterials that are more defect-rich. Future studies designing new carbon nanomaterials for neurotransmitters should focus on not only increasing area, but also promoting a structure with graphitic defects. One of the main advantages of CNSs is that they can be grown on almost any substrate without using a catalyst. Thus, CNSs can be grown on metal wires to batch-fabricate microelectrode sensors, or they can be coated onto an existed carbon structure, such as carbon fiber and pyrolyzed carbon,50 to improve the electrochemical activity. CNSs are a promising carbon nanomaterial that could be more widely used because of the ease of growth and their impressive electrochemical performance.
5. Conclusions
Surface properties of carbon nanomaterials have dramatic effects on their electrochemical performance. CNSs exhibit rough surface morphology, which leads to a larger surface area, and their carbon structure is rich in graphitic defects, which enhances the electrochemical performance. Due to the abundant edge-plane sites which are more electroactive, CNS electrodes show a faster electron transfer rate and more surface adsorption. In FSCV detection, the responses of cation neurochemicals are better for cations than anions, due to enhanced adsorption at CNS electrodes. CNSs are grown without a catalyst layer; therefore, growing CNSs is a relatively low-cost and simple strategy to produce uniform coating. Future research can focus on growing CNSs on different electrode substrates to batch-fabricate electrochemical sensors, or using CNSs to modify an existing surface to enhance the electrochemical properties. For future studies designing new carbon materials for neurotransmitter detection, a structure with graphitic defects should be the focus in addition to increasing surface area.
Supplementary Material
Acknowledgements
This work was funded by NIH R01EB026497 and NIH R01MH085159. A portion of this research was conducted at the Center for Nanophase Materials Sciences, which is a DOE Office of Science User Facility under user agreement CNMS 2017-076 and CNMS 2019-034.
Footnotes
Appendix
Supporting information includes theory on surface area calculations, Supplemental Table 1: Structures of other analytes, Supplemental Table 2: slope of log i vs log t curves for other analytes. Supplemental Fig. 1. Surface roughness profile of CNS, CNT and CF electrodes along the cylinder axis, Supplemental Fig. 2: Comparison of 30 um and 7 um carbon fibers with FSCV, and Supplemental Fig. 3: The ratio of currents of other analytes to dopamine.
References
- 1.Huffman ML and Venton BJ, Electroanalysis, 2008, 20, 2422–2428. [Google Scholar]
- 2.Ganesana M, Lee ST, Wang Y and Venton BJ, Anal. Chem, 2017, 89, 314–341. [DOI] [PMC free article] [PubMed] [Google Scholar]
- 3.Huffman ML and Venton BJ, Analyst, 2009, 134, 18–24. [DOI] [PMC free article] [PubMed] [Google Scholar]
- 4.Cao Q, Puthongkham P and Venton BJ, Anal. Methods, 2019, 11, 247–261. [DOI] [PMC free article] [PubMed] [Google Scholar]
- 5.Yang C, Denno ME, Pyakurel P and Venton BJ, Anal. Chim. Acta, 2015, 887, 17–37. [DOI] [PMC free article] [PubMed] [Google Scholar]
- 6.Chen A and Chatterjee S, Chem. Soc. Rev, 2013, 42, 5425–5438. [DOI] [PubMed] [Google Scholar]
- 7.Banks CE and Compton RG, Analyst, 2006, 131, 15–21. [DOI] [PubMed] [Google Scholar]
- 8.Patel AN, Tan SY, Miller TS, MacPherson JV and Unwin PR, Anal. Chem, 2013, 85, 11755–11764. [DOI] [PubMed] [Google Scholar]
- 9.Sheridan LB, Hensley DK, Lavrik NV, Smith SC, Schwartz V, Liang C, Wu Z, Meyer HM and Rondinone AJ, J. Electrochem. Soc, 2014, 161, H558–H563. [Google Scholar]
- 10.Shanta AS, Al Mamun KA, Hensley D, Lavrik NV, Islam SK and McFarlane N, 2017 39th Annu. Int. Conf. IEEE Eng. Med. Biol. Soc., 2017, 193–196. [DOI] [PubMed] [Google Scholar]
- 11.Shanta AS, Shamsir S, Song Y, Hensley DK, Rondinone AJ, Islam SK and McFarlane N, 2018 40th Annu. Int. Conf. IEEE Eng. Med. Biol. Soc., 2018, 4281–4284. [DOI] [PubMed] [Google Scholar]
- 12.Zestos AG and Venton BJ, J. Electrochem. Soc, 2018, 165, G3071–G3073. [DOI] [PMC free article] [PubMed] [Google Scholar]
- 13.Zestos AG, Yang C, Jacobs CB, Hensley D and Venton BJ, Analyst, 2015, 140, 7283–7292. [DOI] [PMC free article] [PubMed] [Google Scholar]
- 14.Song Y, Peng R, Hensley DK, Bonnesen PV, Liang L, Wu Z, Meyer HM, Chi M, Ma C, Sumpter BG and Rondinone AJ, ChemistrySelect, 2016, 1, 6055–6061. [Google Scholar]
- 15.Obraztsova EA, Basmanov DV, Barinov NA and Klinov DV, Ultramicroscopy, 2019, 197, 11–15. [DOI] [PubMed] [Google Scholar]
- 16.Melechko AV, Merkulov VI, McKnight TE, Guillorn MA, Klein KL, Lowndes DH and Simpson ML, J. Appl. Phys, 2005, 97, 3. [DOI] [PubMed] [Google Scholar]
- 17.Shanta AS, Al Mamun KA, Islam SK, McFarlane N and Hensley DK, Int. J. High Speed Electron. Syst, 2017, 26, 1740008. [Google Scholar]
- 18.Feng M, Han H, Zhang J and Tachikawa H, Electrochem. Sensors, Biosens. their Biomed. Appl, 2008, 14, 459–501. [Google Scholar]
- 19.Yang W, Ratinac KR, Ringer SR, Thordarson P, Gooding JJ and Braet F, Angew. Chemie - Int. Ed, 2010, 49, 2114–2138. [DOI] [PubMed] [Google Scholar]
- 20.Britto PJ, Santhanam KSV and Ajayan PM, Bioelectrochemistry Bioenerg, 1996, 41, 121–125. [Google Scholar]
- 21.Hočevar SB, Wang J, Deo RP, Musameh M and Ogorevc B, Electroanalysis, 2005, 17, 417–422. [Google Scholar]
- 22.Jacobs CB, Vickrey TL and Venton BJ, Analyst, 2011, 136, 3557–3565. [DOI] [PMC free article] [PubMed] [Google Scholar]
- 23.Xiao N and Venton BJ, Anal. Chem, 2012, 84, 7816–7822. [DOI] [PMC free article] [PubMed] [Google Scholar]
- 24.Jacobs CB, Ivanov IN, Nguyen MD, Zestos AG and Venton BJ, Anal. Chem, 2014, 86, 5721–5727. [DOI] [PMC free article] [PubMed] [Google Scholar]
- 25.Zestos AG, Jacobs CB, Trikantzopoulos E, Ross AE and Venton BJ, Anal. Chem, 2014, 86, 8568–8575. [DOI] [PMC free article] [PubMed] [Google Scholar]
- 26.Schmidt AC, Wang X, Zhu Y and Sombers LA, ACS Nano, 2013, 7, 7864–7873. [DOI] [PubMed] [Google Scholar]
- 27.Yang C, Jacobs CB, Nguyen MD, Ganesana M, Zestos AG, Ivanov IN, Puretzky AA, Rouleau CM, Geohegan DB and Venton BJ, Anal. Chem, 2016, 88, 645–652. [DOI] [PMC free article] [PubMed] [Google Scholar]
- 28.Xiang L, Yu P, Hao J, Zhang M, Zhu L, Dai L and Mao L, Anal. Chem, 2014, 86, 3909–3914. [DOI] [PubMed] [Google Scholar]
- 29.Behabtu N, Green MJ and Pasquali M, Nano Today, 2008, 3, 24–34. [Google Scholar]
- 30.Yang C, Trikantzopoulos E, Nguyen MD, Jacobs CB, Wang Y, Mahjouri-Samani M, Ivanov IN and Venton BJ, ACS Sensors, 2016, 1, 508–515. [DOI] [PMC free article] [PubMed] [Google Scholar]
- 31.Roberts JG and Sombers LA, Anal. Chem, 2018, 90, 490–504. [DOI] [PMC free article] [PubMed] [Google Scholar]
- 32.Lord HL, Zhan W and Pawliszyn J, Fundamentals and applications of needle trap devices, 2012, vol. 2. [DOI] [PubMed] [Google Scholar]
- 33.McCreery RL, Chem. Rev, 2008, 108, 2646–2687. [DOI] [PubMed] [Google Scholar]
- 34.Rice RJ, Pontikos NM and McCreery RL, J. Am. Chem. Soc, 1990, 112, 4617–4622. [Google Scholar]
- 35.Rice RJ and McCreery RL, Anal. Chem, 1989, 61, 1637–1641. [Google Scholar]
- 36.García-Miranda Ferrari A, Foster CW, Kelly PJ, Brownson DAC and Banks CE, Biosensors, 2018, 8, 53. [DOI] [PMC free article] [PubMed] [Google Scholar]
- 37.Kneten KR and McCreery RL, Anal. Chem, 1992, 64, 2518–2524. [Google Scholar]
- 38.Dresselhaus MS, Jorio A, Hofmann M, Dresselhaus G and Saito R, Nano Lett, 2010, 10, 751–758. [DOI] [PubMed] [Google Scholar]
- 39.Ferrari AC and Robertson J, Phys. Rev. B - Condens. Matter Mater. Phys, 2001, 64, 075414. [Google Scholar]
- 40.Kachoosangi RT and Compton RG, Anal. Bioanal. Chem, 2007, 387, 2793–2800. [DOI] [PubMed] [Google Scholar]
- 41.Bhuvana T, Kumar A, Sood A, Gerzeski RH, Hu J, Bhadram VS, Narayana C and Fisher TS, ACS Appl. Mater. Interfaces, 2010, 2, 644–648. [DOI] [PubMed] [Google Scholar]
- 42.Chen P, Fryling MA and McCreery RL, Anal. Chem, 1995, 67, 3115–3122. [Google Scholar]
- 43.Chen P and McCreery RL, Anal. Chem, 1996, 68, 3958–3965. [Google Scholar]
- 44.Brownson DAC, Foster CW and Banks CE, Analyst, 2012, 137, 1815–1823. [DOI] [PubMed] [Google Scholar]
- 45.Hersey M, Berger SN, Holmes J, West A and Hashemi P, Anal. Chem, 2019, 91, 27–43. [DOI] [PubMed] [Google Scholar]
- 46.Ross AE and Venton BJ, Analyst, 2012, 137, 3045–3051. [DOI] [PMC free article] [PubMed] [Google Scholar]
- 47.Takmakov P, Zachek MK, Keithley RB, Walsh PL, Donley C, McCarty GS and Wightman RM, Anal. Chem, 2010, 82, 2020–2028. [DOI] [PMC free article] [PubMed] [Google Scholar]
- 48.Bath BD, Michael DJ, Trafton BJ, Joseph JD, Runnels PL and Wightman RM, Anal. Chem, 2000, 72, 5994–6002. [DOI] [PubMed] [Google Scholar]
- 49.Roberts JG, Moody BP, McCarty GS and Sombers LA, Langmuir, 2010, 26, 9116–9122. [DOI] [PubMed] [Google Scholar]
- 50.Yang C, Cao Q, Puthongkham P, Lee ST, Ganesana M, Lavrik NV and Venton BJ, Angew. Chemie - Int. Ed, 2018, 57, 14255–14259. [DOI] [PMC free article] [PubMed] [Google Scholar]
Associated Data
This section collects any data citations, data availability statements, or supplementary materials included in this article.


