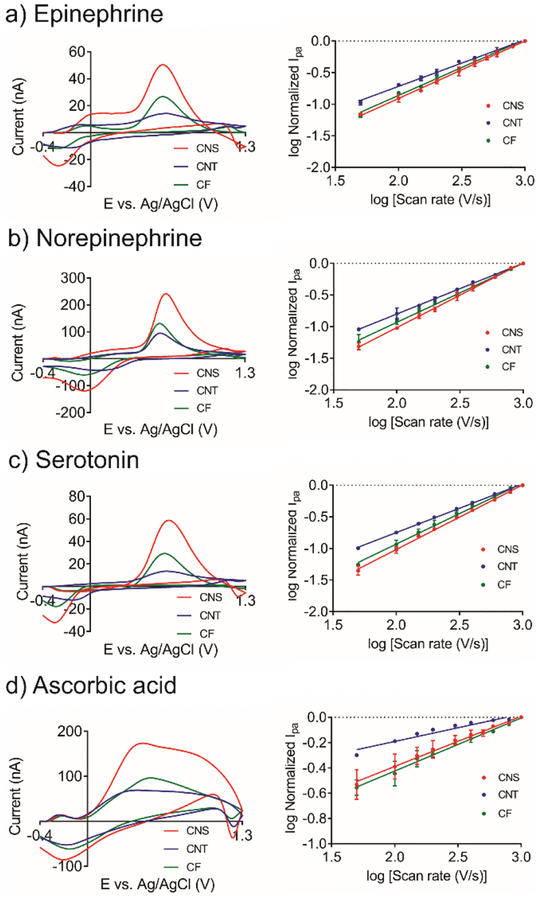
Figure 7.
Detection of other neurochemicals at CNS, CNT and CF microelectrodes. FSCV responses (Left column) and scan rate study (Right column, n = 3) of a) 1 μM epinephrine, b) 1 μM norepinephrine, c) 1 μM serotonin, d) 200 μM ascorbic acid in PBS buffer. For slopes of lines in log i vs log v plots, see Table S2.

