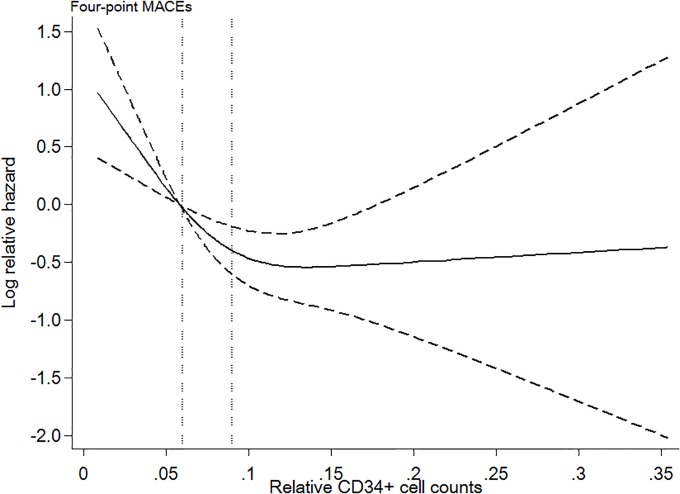
Fig 3. Log relative hazard of 4-point MACEs for relative CD34+ cell counts in the restricted cubic spline curve.
The reference is the cut-off point between the lowest and medium tertiles; the two vertical dotted lines indicate the cut-off for these tertiles (0.06 and 0.09, respectively). The graph has three knots that are truncated at the 1st and 99th percentiles.

