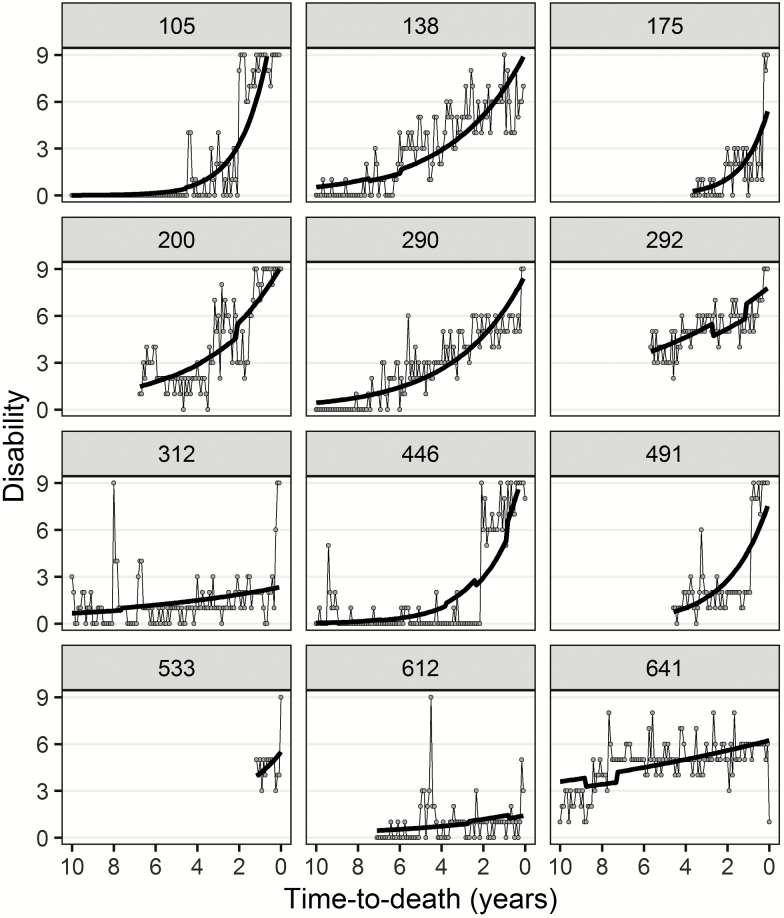
Figure 1.
Long-term disability trajectories and short-term fluctuations in disability in the last 10 years of life for 12 random respondents. Disability is scored as 0–9 based on need for personal assistance (no/yes) in four activities of daily living (ADLs) and five instrumental activities of daily living (IADLs). Thick lines show fitted disability values (fixed and random effects) from model 1 (Poisson mixed model), dots represent actual observations, which are connected by thin lines. The vertical difference between actual observations and subject-specific long-term disability trajectories reflects observation-level residuals. Breaks in the fitted disability trajectories are due to frailty and living alone, which are time-varying predictor variables. Numbers in the header refer to respondent’s ID. Depending on how many observations respondents provided before death (minimum = 6), time-to-death varies up to a maximum of 10 years before death.

